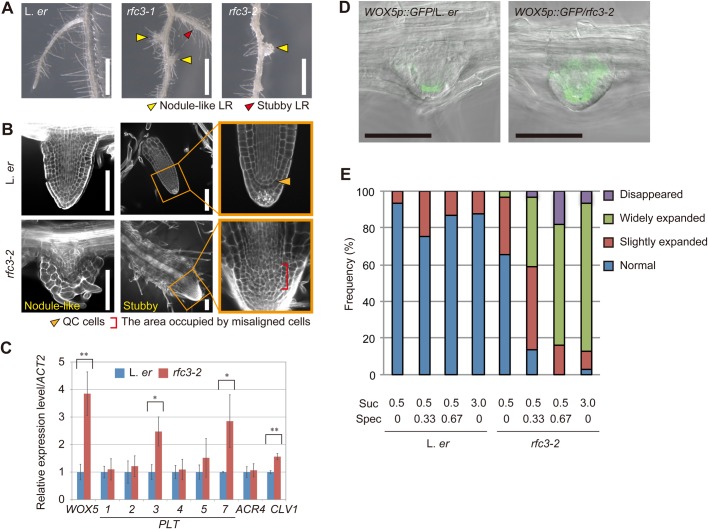
Fig. 4.
Characterization of the rfc3 LR phenotype. (A) The LR phenotype of rfc3 alleles. Yellow arrowheads indicate nodule-like LRs; red arrowhead indicates a stubby LR. (B) Nodule-like LRs (left panel) and stubby LRs (middle and right panels) observed by modified pseudo-Schiff-propidium iodide (mPS-PI) staining. Orange arrowhead indicates QC cells, red bracket indicates the area occupied by misaligned or stratified cells. (C) Relative expression of root stem cell regulatory genes in roots measured by RT-qPCR (n=3). Statistical analyses were carried out as described in Fig. 3. (D) WOX5p::GFP patterns (green) merged with bright field images in LR primordia. (E) Phenotype frequencies of WOX5p:GFP in L. er and rfc3-2 LRs grown in different concentrations of sucrose and Spec. Sucrose and Spec concentrations are indicated by percentage and mg l−1, respectively. Individual LR primordia were classified into normal, slightly expanded, widely expanded and disappeared WOX5p::GFP expression patterns. LR primordia beyond stage VI and LRs up to 200 µm were scored. The total number of LR primordia plus LRs in each condition was >76. Scale bars: 1 mm (A), 100 µm (B,D). Statistical analyses were carried out as described in Fig. 3.

