Fig. 5.
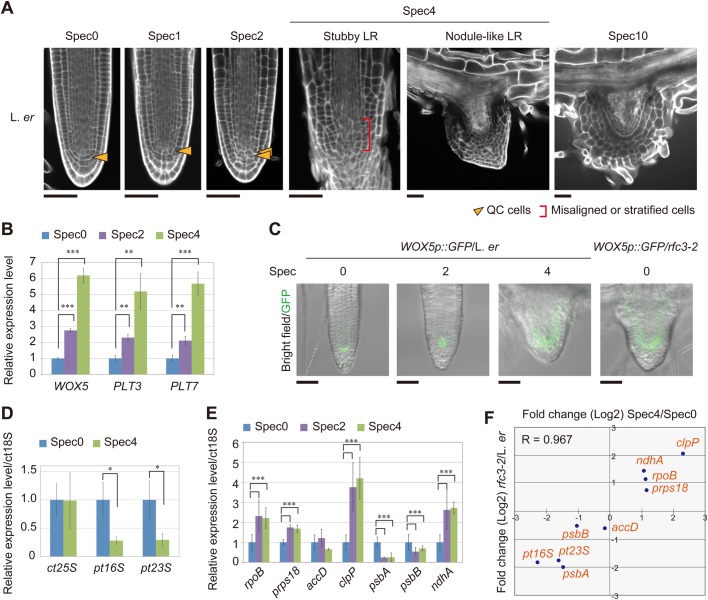
Effect of the plastid translation inhibitor Spec on LR development. (A) mPS-PI-stained LRs of L. er plants grown on medium containing various Spec concentrations. Arrowheads indicate the position of the QC cells, brackets indicate the area occupied by misaligned or stratified cells. (B) Relative expression levels of WOX5, PLT3, and PLT7 in Spec-treated plants (n=3). (C) Distribution of GFP fluorescence (green) in WOX5p::GFP merged with bright field images. (D,E) Relative transcript levels of plastid ribosomal RNAs (D) and plastid-encoded genes (E) in roots (n=3). (F) Correlation analysis of changes in expression (Log2) in plastid-encoded genes resulting from the rfc3 mutation and 4 mg l−1 Spec treatment. R, Pearson's correlation value. Statistical analyses were carried out as described in Fig. 3. Scale bars: 50 µm (A,C).

