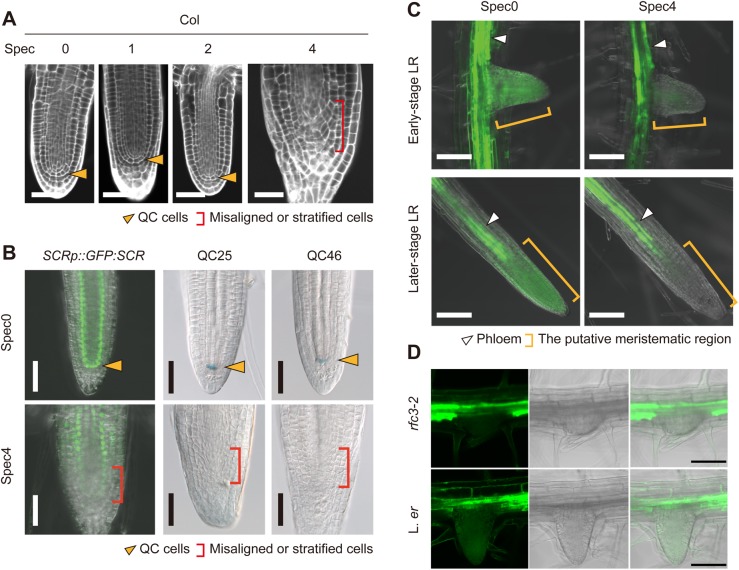
Fig. 7.
Spec treatment of Col-0-background meristem marker lines and the SUC2p::sGFP line. (A) mPS-PI-stained LRs of Col-0 plants treated with Spec. (B) SCRp::GFP:SCR/scr, QC25, and QC46 expression patterns. Orange arrowheads indicate the position of the QC cells, red brackets indicate the area occupied by misaligned or stratified cells. (C,D) GFP patterns in LRs of Spec4-treated SUC2p::sGFP in the wild-type Col-0 (C) and rfc3-2 (D) backgrounds. The green signals in B, C and D are GFP fluorescence; the blue signal in B is β-glucuronidase (GUS)-stained cells. White arrowheads indicate phloem, orange brackets indicate the meristem region. Scale bars: 50 µm (A,B), 100 µm (C,D).

