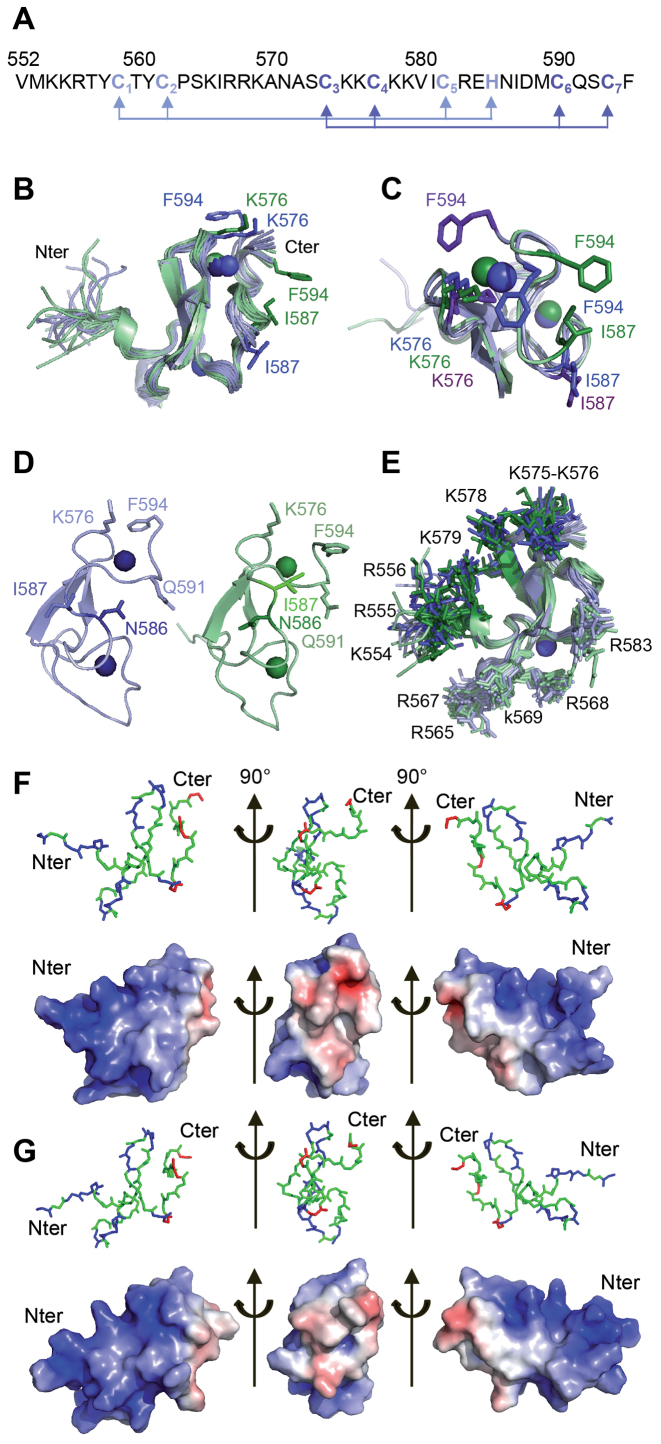
Figure 4.
Structure of the PB C-terminal Cysteine-Rich Domain (A) Sequence of the PB(552–594) peptide: the light blue and dark blue arrows highlight the Cys3-His (ZF1) and Cys4 (ZF2) coordination mode. (B) Superposition of the twenty-four structures generated using ARIA ensemble showing the I587/F594 and K576/F594 proximities in PB(552–594)IF (in green) and in PB(552–594)KF (in blue). (C) Superimposition of one structure of the PB(552–594)IF family (in green) and two of the PB(552–594)KF family (in blue) showing the two possible K576/F594 orientations in PB(552–594)KF (the K576 and F594 side chains are in blue for one orientation and in purple for the other one). (D) Comparison of one structure of each family highlights the relative orientation of N586 and I587: in family PB(552–594)KF (in blue) the side chain of residue N586 is turned towards residue Q591, whereas in family PB(552–594)IF (in green) the side chain of residue N586 points in the other direction. (E) Superposition of the twenty-four structures, highlighting the two positively charged clusters of Arg and Lys residues in dark blue (PB(552–594)KF family) and dark green (PB(552–594)IF family) on one side (554-KRR-556, K575, K576, K578, K579) and in light green and blue on the other side (K565, 567-RRK-569, R583). The two 554-KKR-556 and 565-KIRRK-569 stretches of residues belonging to the bipartite NLS are localised on the same face of PB(552–594). (F) Electrostatic potential calculated on one structure of the PB(552–594)KF family. (G) Electrostatic potential calculated on one structure of the PB(552–594)IF family. The red and blue colors in surface representations denote negative and positive charges, respectively. Graphic representations were performed with PyMOL. Each view corresponds to a 90° rotation of the previous one.

