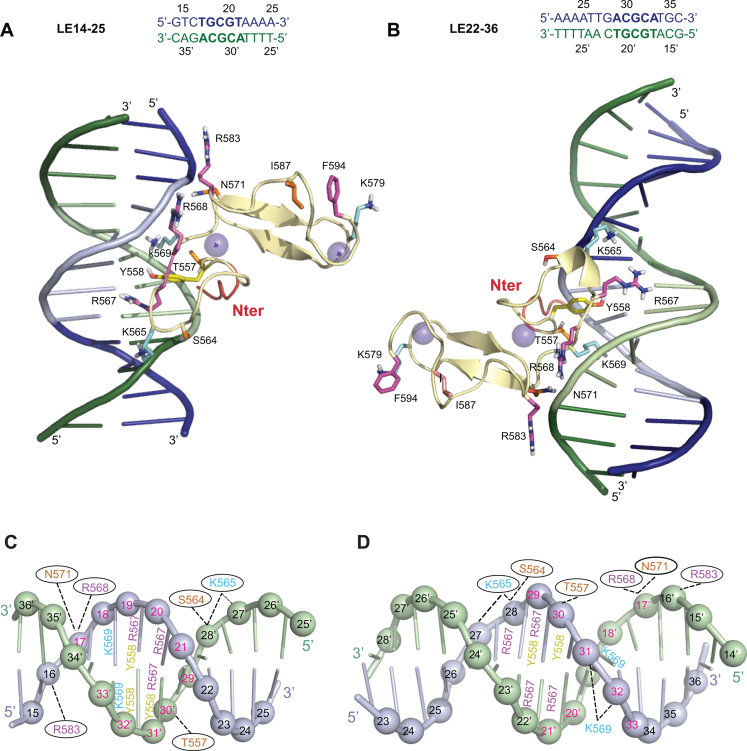
Figure 6.
Comparison of the top cluster 1 models for the PB(552–594)IF/LE14–25 and PB(552–594)IF/LE22–36 complexes. (A) and (C) show the model constructed with LE14–25. (B) and (D) show the model construct with LE22–36. Only the PB(552–594)IF interacting residues (corresponding to those used as ambiguous interaction restraints in docking calculations in HADDOCK) and the residues belonging to the flexible C-terminal domain are represented. K565, K569 and K579 are in cyan, R567, R568, R583 and F594 are represented in pink, T557, S564, N571 and I587 are coloured in orange, Y558 is in yellow. The five N-terminal residues ribbon is coloured in red. (A and B) The top strand is in blue and the complementary strand in green, and the 5′-TGCGT3′-/3′-ACGCA-5′ and 5′-ACGCA3′-/3′-TGCGT-5′ sequences highlighted in light blue and light green respectively. (C and D) LE14–25 and LE22–36 are represented in a cartoon representation and the phosphorus atoms are shown as spheres. The top strand is in light blue and the complementary strand in light green. The 5′-TGCGT-3′/3′-ACGCA-5′ and 5′-ACGCA-3′/3′-TGCGT-5′ inverted sequences are highlighted with the number in red. The PB(552–594)IF interacting residues are highlighted and positioned on the nucleotide with which they interact. When the interactions take place in the major groove with the edges of the base the numbers are localized on the bases (except for K569), and when the contacts are at the level of the sugar phosphate backbone, the numbers are inside of black ovals.

