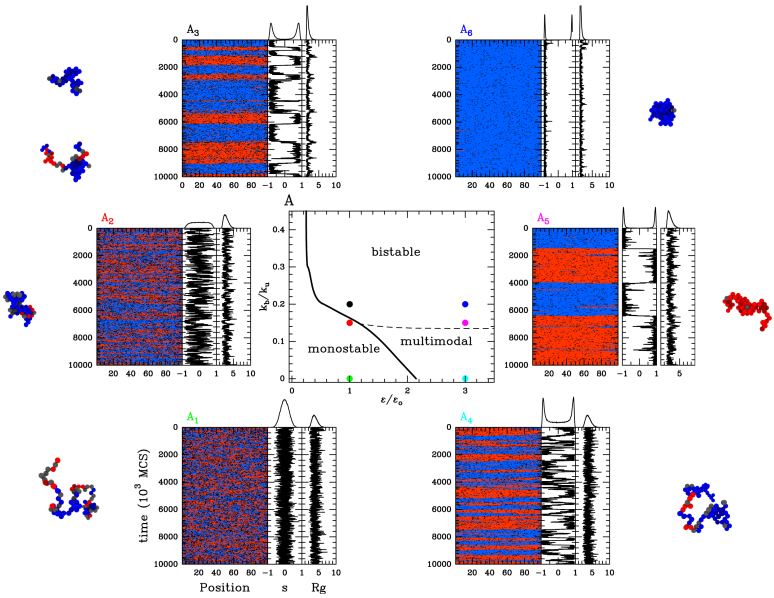
Figure 4.
The ‘cis& trans’ spreading model with epigenomic-driven self-attraction (ϵc = ϵt ≡ ϵ, ϵo = 0.001, ku = 0.001). Epigenomic phase diagram in the (ϵ/ϵo, kb/ku) plane. The monostable and multimodal/bistable regions are demarcated by the transition black curve. Due to finite-size effects, the observed multimodality might not reflect a true bistable dynamics (see text). The limit between multimodality and bistability is represented by the black dashed line. (A1, .., 6). Examples of time evolution of the local epigenomic state, of the global epigenomic state and of the radius of gyration Rg for ϵ/ϵo = 1, kb/ku = 0 (A1), ϵ/ϵo = 1, kb/ku = 0.15 (A2), ϵ/ϵo = 1, kb/ku = 0.2 (A3), ϵ/ϵo = 3, kb/ku = 0 (A4), ϵ/ϵo = 3, kb/ku = 0.15 (A5) and ϵ/ϵo = 3, kb/ku = 0.2 (A6).

