Figure 5.
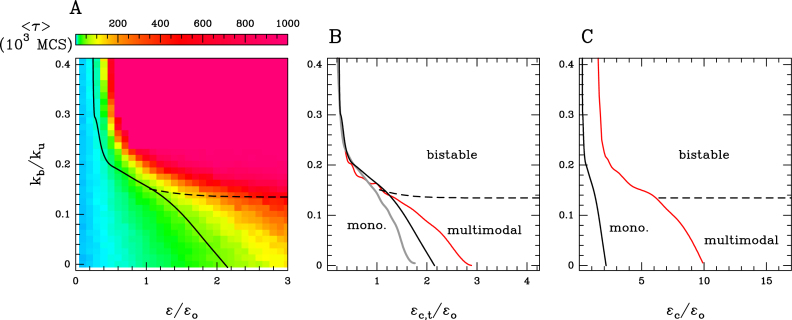
(A) Stability of the global epigenomic state for the ‘cis &trans’ spreading model with epigenomic-driven self-attraction (ϵc = ϵt ≡ ϵ, ϵo = 0.001, ku = 0.001). Heatmap of the MFPT 〈τ〉 to switch from the I macro-state s = −1 to a A state (s > 0) (see ‘Materials and Methods’ section) as a function of the attraction kb/ku and recruitment strength ϵ/ϵo. The monostable and multimodal/bistable regions are demarcated by the transition black curve. (B and C) Epigenomic phase diagrams for different dynamical regimes (B) Transition curves for an epigenomic dynamics ten times slower (ϵo = 0.0001) (gray) and ten times faster (ϵo = 0.01) (red) than the reference case considered in Figure 4A) (ϵc = ϵt, ϵo = 0.001) (black). (C) Transition curve for a cis spreading ten times greater than the trans spreading (ϵc = 10ϵt, ϵo = 0.001) (red) and for the reference case (ϵc = ϵt, ϵo = 0.001) (black). In (A–C) the limit between multimodality and bistability is represented by the black dashed line.

