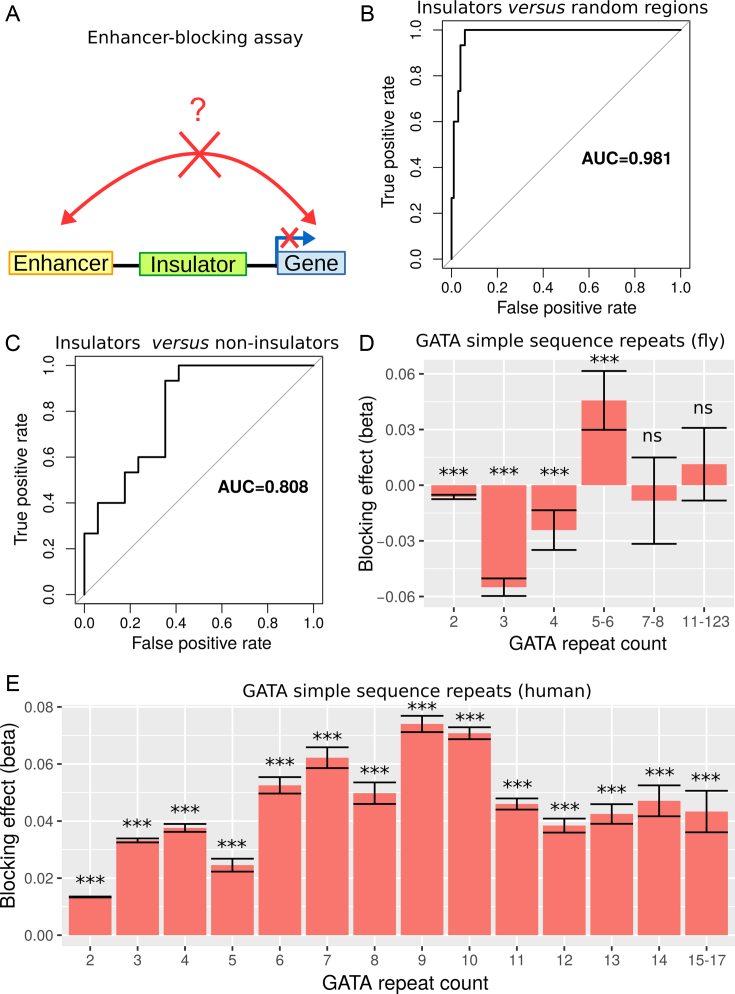
Figure 2.
Validation of the model with enhancer-blocking assays (EBAs) from Drosophila and human. (A) Illustration of the EBAs. (B) ROC curves of the prediction of insulating regions (positives) as compared to randomly drawn regions (negatives) in Drosophila. Area under the ROC curve (AUC) is plotted. (C) ROC curves of the prediction of insulating regions (positives) as compared to non-insulating regions (negatives) in Drosophila. (D) Blocking effects of GATA SSRs depending on the repeat count in Drosophila. (E) Blocking effects of GATA SSRs depending on the repeat count in human.

