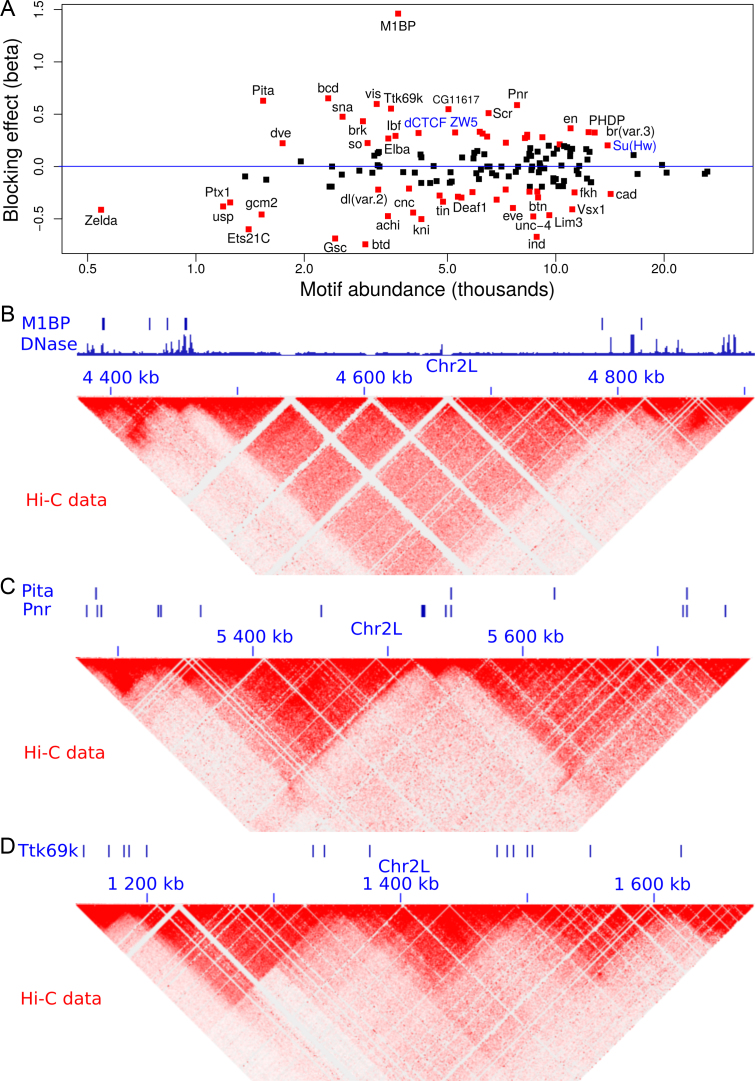
Figure 4.
Analysis of protein binding DNA motifs in Drosophila. (A) Blocking effect (β) in function of motif abundance ( are shown in red; known architectural proteins are written in blue). (B) Example showing the accumulation of M1BP motifs and DNase I hypersensitive sites between 3D domains. (C) Example showing the accumulation of Pita and Pnr motifs between 3D domains. (D) Example showing the accumulation of Ttk69k motifs between 3D domains.

