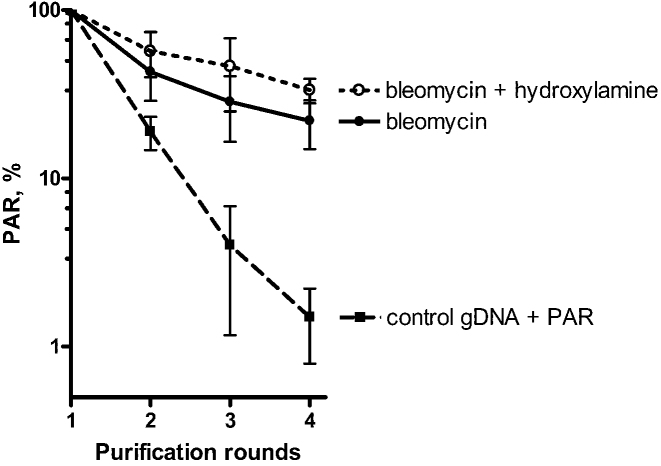
Figure 7.
Differential loss of the PAR signal in dot blotting experiments during successive procedures of gDNA purification from HeLa PARGKD cells treated with bleomycin as compared to control gDNA mixed with free PAR. Graphical representation of the PAR level detected in 1200-ng dots of gDNA after each purification round. Control gDNA was purified from untreated HeLa BD650 cells. The PAR signal after the first purification round was set to 100%. The error bars represent SD (n = 3). For details, see ‘Materials and Methods’ section and Supplementary Figure S14.

