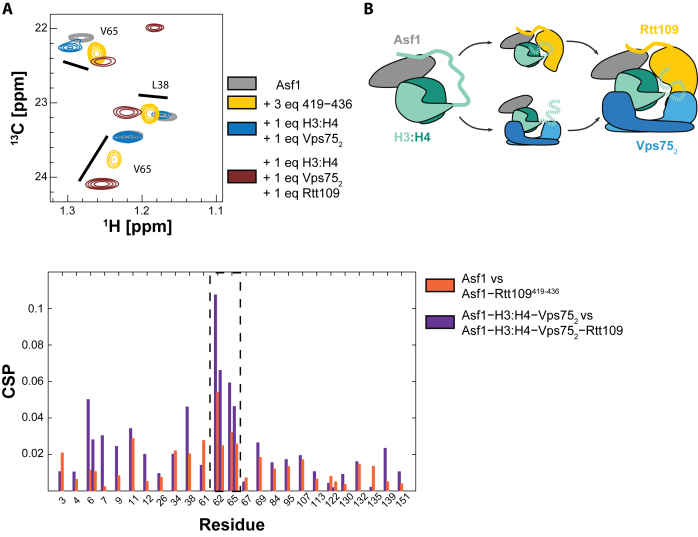
Figure 5.
The Rtt109–Asf1 interaction is retained in a larger enzymatic complex. (A) Overlay of 13C-HMQC spectra and CSP analysis of ILV-labeled Asf1 (grey) in complex with Rtt109419–436 (yellow), H3:H4−Vps752 (blue) or H3:H4−Vps752−Rtt109 (brown). The full spectrum is shown in Supplementary Figure S10. CSPs are calculated between Asf1 and Asf1–Rtt109419–436 (orange), and between Asf1–H3:H4–Vps752 and Asf1–H3:H4–Vps752–Rtt109 (purple). The spectra were acquired in 50 mM sodium citrate pH 6.5, 150 mM NaCl, 5 mM BME at 850 MHz and 298 K. (B) Schematic summarizing the described interactions. The H3 tail interacts with Asf1 in the Asf1−H3:H4 complex. This interaction can be released by addition of Vps75 or Rtt109.

