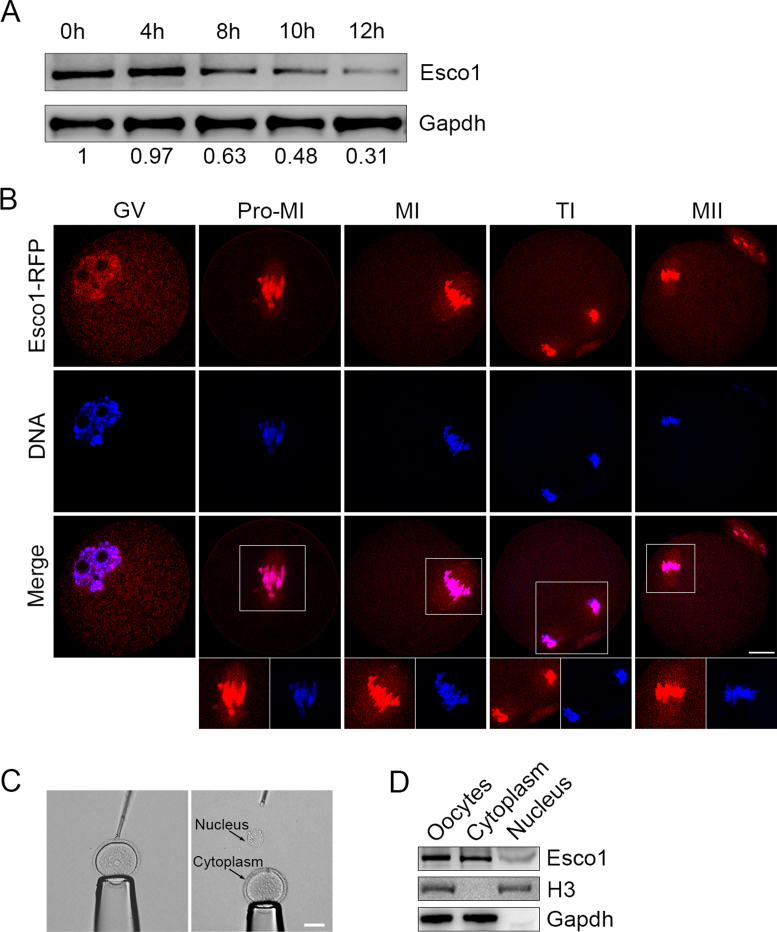
Figure 1.
Protein expression and subcellular localization of Esco1 during mouse meiotic maturation. (A) Protein levels of Esco1 at specific time point corresponding to various developmental stages during meiotic maturation: 0 h, GV; 4 h, Pro-M I (prometaphase I); 8 h, M I (metaphase I); 10 h, T I (telophase I); 12 h, M II (metaphase II). The blots were probed with anti-Esco1 antibody and anti-Gapdh antibody, respectively. (B) Mouse oocytes at GV, Pro-M I, M I, T I and M II stages were microinjected with Esco1-RFP cRNA (red) and counterstained with Hoechst (blue). Images were acquired under the confocal microscope. Scale bar, 20 μm. The relative fluorescent intensity of Esco1 signals in the nucleus/cytoplasm in GV oocytes was 0.35. (C) Representative image of the oocyte before and after isolation of GV. Scale bar, 40 μm. (D) Protein levels of Esco1 in intact oocytes, cytoplasm and GV (nucleus). The blots were probed with anti-Esco1 antibody, anti-H3 antibody and anti-Gapdh antibody, respectively. The relative gray value of Esco1 bands in the nucleus/cytoplasm was 0.32.

