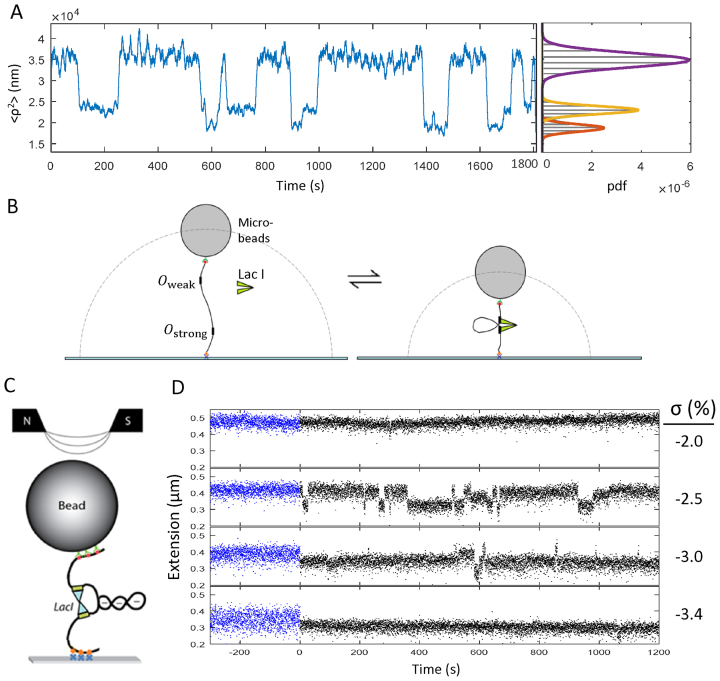
Figure 1.
Experimental schematics and representative data. (A) A representative recording of mean squared excursion versus time shows intermittent changes in the average excursion of the bead as LacI-induced looping changes the overall tether length in a 909 bp Os-400-O1 DNA tether. At right, a histogram of the excursion values for the recordings exhibits three peaks which represent the two looped states and the unlooped state fitted with Gaussian curves, shown in red, yellow, and purple respectively. Similar data were recorded for 831-bp-long O1-400-O2 tethers (not shown). (B) A schematic representation of tether length changes due to LacI-induced DNA looping during a TPM experiment (not to scale). (C) A schematic representation of writhe created using a magnetic tweezer and trapped within a LacI-mediated loop (not to scale). Red/green dots indicate biotin/streptavidin linkages of DNA to beads. Orange diamonds/blue crosses indicate digoxigenin/antidigoxigenin linkages of DNA to glass. O1-400-O2 DNA looped by LacI is shown to trap three negative (-) supercoils. The north and south poles of magnets above the microscope stage create a magnetic field to attract and rotate the bead to allow stretching and twisting of the DNA. (D) Recordings of the extension of a 2115 bp-long O1–400-O2 DNA tether under 0.45 pN of tension at different levels of negative supercoiling in the absence (blue) and in the presence (black) of LacI. Extended (unlooped) states dominate at low negative linking number values but become intermittent and finally disappear altogether as negative supercoiling increases and favors the looped state.

