Figure 2.
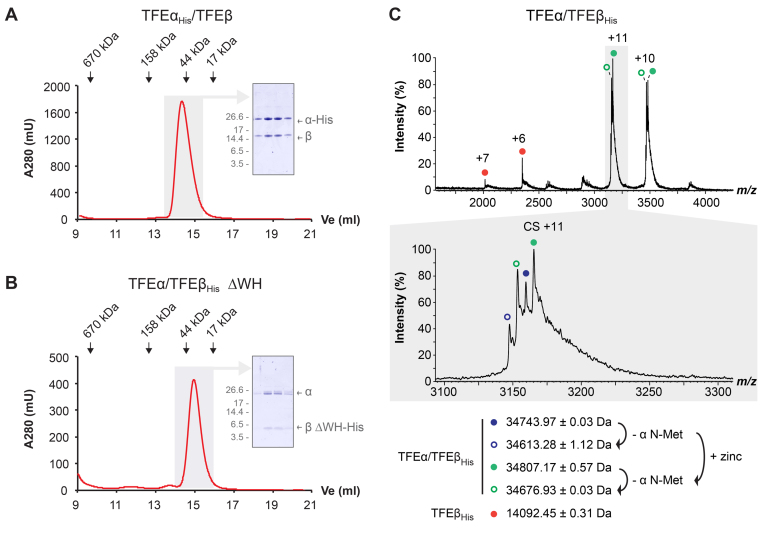
Hvo TFEα and TFEβ form a dimeric complex in the absence of an FeS cluster. (A and B) Size exclusion chromatography of TFEαHis/TFEβ (A) and TFEα/TFEβ ΔWHHis (B) on a superose 12 h 10/30 column. Elution peaks of standard proteins are indicated. Peak fractions (highlighted in gray) were subjected to SDS-PAGE and Coomassie-staining (insert) to show symmetric elution of both subunits. (C) nESI mass spectrum of TFEα/TFEβHis. The different charge state series observed are labelled with red, blue and green filled circles. Charge state series derived from additional cleavage of TFEα N-Met are labelled with open circles. Highlighted in gray is a zoom over the region that includes charge state (CS) +11. All detected masses indicate the absence of a cubane 4Fe–4S cluster (352 Da).

