Figure 6.
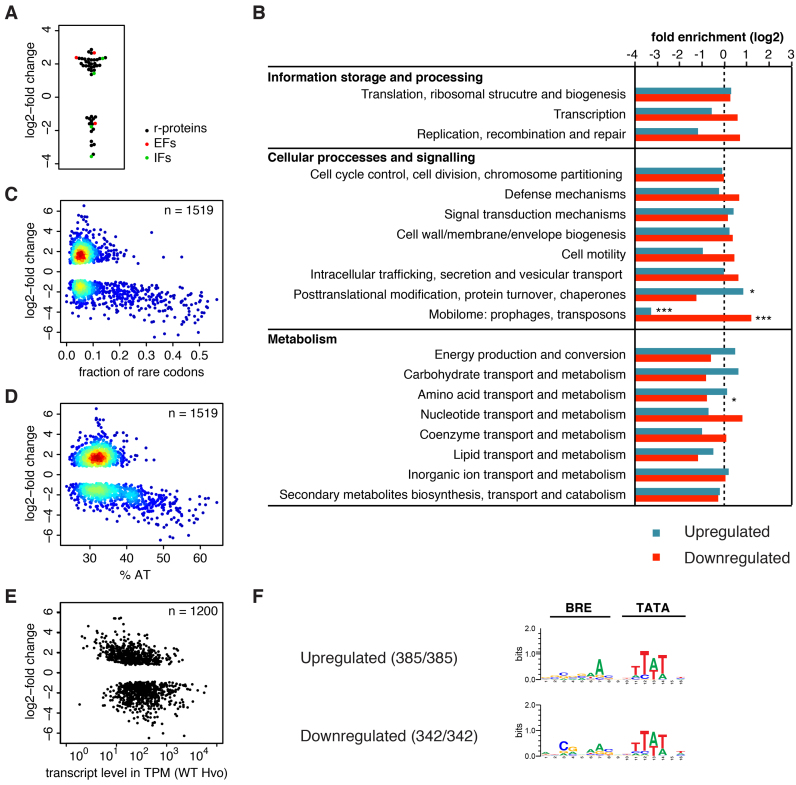
Deletion of tfeB leads to widespread misregulation of transcription. (A) log2-fold change in relative transcript abundance (Padj < 0.01) of genes coding for the basal translation machinery, ribosomal proteins (black), translation initiation factors (green) and elongation factors (red). (B) Analysis arCOG category distribution in significantly misregulated genes (Padj < 0.01). Significant enrichment or underrepresentation is indicated (two-sided Fisher's exact test with Bonferroni correction for multiple testing) with * and *** denoting Padj < 0.05 and 0.001, respectively. (C and D) Heatscatter plot of rare codon frequency (defined as codons with less than 10% synonymous codon usage genome-wide) (C) and AT content of genes (D) against the log2-fold change (Padj < 0.01) in relative transcript abundance. (E) Plot showing the estimated transcript levels in parental strain H26 (transcripts per million, TPM, geometric mean for the two replicates) calculated for the transcription units of Hvo using RSEM (31) against the log2-fold change in relative transcript abundance for the first cistron within the respective transcription unit (Padj < 0.01). (F) BRE/TATA motif consensus in misregulated genes. In order to account for variable spacing between the TSS and BRE/TATA motifs we conducted a motif search using the MEME software version 4.11.4 (0 or 1 occurrence per sequence, 4 to 16 bp width, searching given strand only) (33). A background model based on the composition of the combined H. volcanii DS2 genome was employed. BRE/TATA motifs were discovered in all sequences.

