Figure 3.
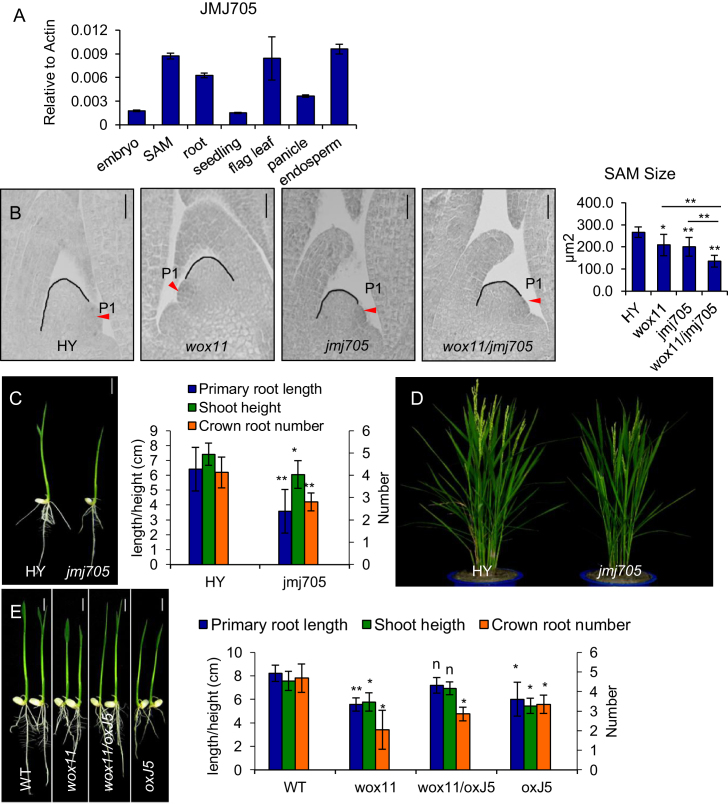
JMJ705 is involved in shoot development. (A) qRT-PCR analysis of JMJ705 transcript levels (relative to Actin transcripts) in SAM, 2-day germinated embryo (embryo), root, 14-day-old seedling (seedling), flag leaf, panicle and endosperm. (B) Shoot apex sections of 5 days HY, wox11, jmj705, and the double mutant (wox11/jmj705) (left). Statistical analysis of SAM sizes is shown on the right. Black line traces the SAM contour between leaf primordia P1 and P2. Red arrow indicates P1 leaf primordia. Bar = 20 μm. *P < 0.05, **P < 0.01, t-test, two sided (N = 10). (C) Phenotype of HY and jmj705 mutant at 7 days after germination. Bar = 1 cm. Statistical analysis is shown on the right. *P < 0.05, **P < 0.01, t-test, two sided (N = 25). (D) Morphology of HY and jmj705 at heading stage in the field. (E) Phenotype of the segregated wild type (WT), the JMJ705-FLAG in wild type background (oxJ5), the wox11 mutant in wild type background (wox11) and JMJ705-FLAG in wox11 background (wox11/oxJ5), from F2 of the crosses between wox11 and oxJ5–5 (left) at 7 days after germination. Bar = 1 cm. Statistical analysis of phenotypes are shown on the right. *P < 0.05, **P < 0.01, n, not significant, t-test, two sided (N = 30).

