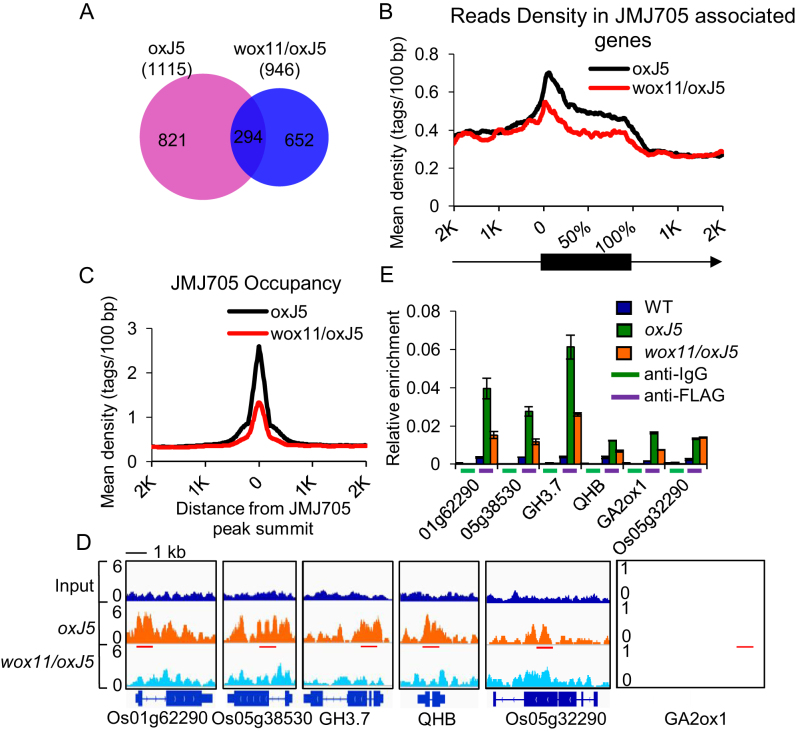
Figure 7.
WOX11-dependent recruitment of JMJ705 to genomic loci. (A) Venn diagram displaying significant overlaps between genes occupied by JMJ705 in oxJ5 and wox11/oxJ5. (B) Mean density of JMJ705 occupancy at all JMJ705-associated genes in oxJ5 (1115 genes) as compared to genes with wox11/oxJ5 (946). Numbers of sequenced tags (Y-axis) per 5% of the genic region (black box) or per 100 bp intervals in the 2-kb genomic region flanking the gene (line, X-axis) are shown. Arrow indicates the direction of transcription. (C) Mean density of JMJ705 occupancy at all JMJ705-associated sites (peaks found in oxJ5) in oxJ5 and wox11/oxJ5. The average signal within 2-kb genomic regions flanking the center of the JMJ705 peaks is shown. (D) The Integrative Genomics Viewer (IGV) views of JMJ705 signal on representative genes in oxJ5 and wox11/oxJ5. Gene structures and name are shown underneath. Red lines represent tested regions in ChIP-qPCR. The scale was identical for different tracks, and the Y-axis scales represent normalized signal of shifted merged MACS tag counts for every 10-bp window. Bar = 1 kb. (E) ChIP-qPCR detection of JMJ705 occupancy with anti-IgG (negative control) and anti-FLAG at genes loci listed in (D) in WT, oxJ5 and wox11/oxJ5 apex. Os05g32290 was used as a negative control. Y-axis means assay-site fold enrichment of the signal from immunoprecipitation over the background.

