
Fig. 3.
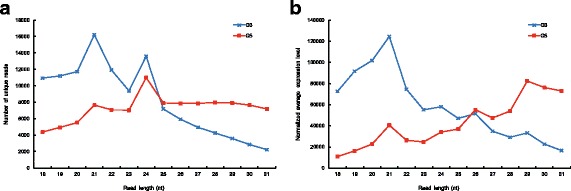
Features of the small RNA population by transcript length. a The number of unique transcripts were the greatest for 21 nt transcripts. G3 and G5 both showed a peak for 24 nt transcripts. The population of unique reads increased with the length of transcripts in G5, whereas it declined in G3 for transcripts longer than 25 nt. b The expression level of small RNA transcripts similarly showed a spike at 21 nt. Also, the expression level increased with the length of small RNA transcripts specific to G5