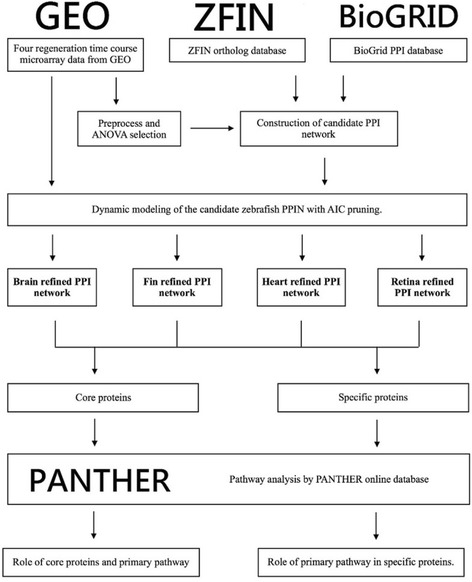
Fig. 1.

Flow chart of PPI network design and analysis approaches. This study used online datasets including the GEO online datasets, ZFIN ortholog database, BioGRID PPI database, and PANTHER protein classification system. Microarray data from four organ regeneration experiments including heart, cerebellum, fin, and retina, were used with high-throughput data and integrated dataset preprocessing to construct candidate PPI networks. Next, regression dynamic models were applied to derive the interaction abilities in each PPI, using the Akaike’s Information Criterion method to prune false-positive PPIs. Finally, dynamic PPI networks were refined for the four organ regeneration processes. Subsequent analysis of the intersection set (the core PPI network) and relative complement sets (the organ-specific proteins) to investigate the regeneration strategy for both the core PPI network and organ-specific proteins was conducted using PANTHER
