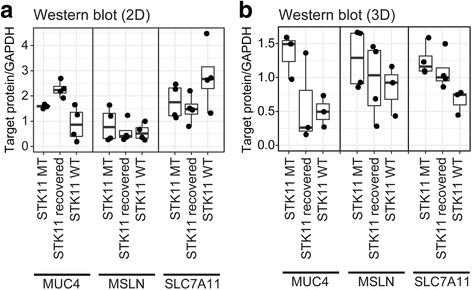
Fig. 5.

Comparison of MUC4, MSLN, SLC7A11 protein expression among STK11 mutant, recovered, and wild-type cell lines in 2D and 3D culture models. (a) P-values in 2D culture model are 0.04, 0.23, and 0.11 for MUC4, MSLN, and SLC7A11 resp. (b) P-values in 3D culture model are 0.01, 0.11, and 0.008 for the same order
