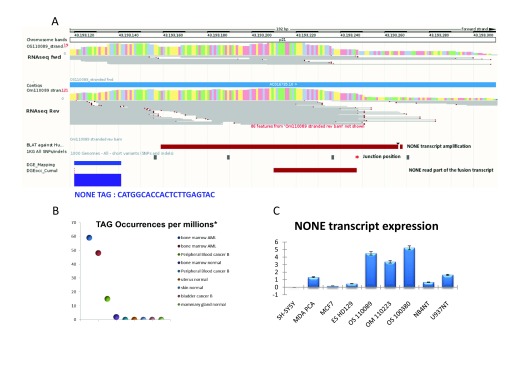
Figure 2. NONE transcript sequencing and expression.
A) Display of the ENSEMBL genome browser viewer for the NONE transcribed region. The blue horizontal bars represent the genomic sequence. The histogram of the RNA-Seq coverage in the chromosomal region is displayed on both strands (OS110089 stranded and RNA-seq fwd/rev tracks). Public and personal DGE data (‘DGE tag location’ track: blue rectangle for occurrence>2) are displayed on both strands of the chromosome, with their relative occurrences (histogram of ‘DGE expression level’ track) using a private DAS server. ( B) Relative expression of the NONE tag per million reads in the DGE datasets (Philippe, et al. 2013). ( C) Relative expression of the NONE transcript in different cell lines and AML samples (NT refers to not treated cells). The relative gene expression was determined using the 2-ΔΔCT method. Transcriptional modulation was calculated by comparing various lineages with SH-SY5Y (subline of the neuroblastoma cell line SK-N-SH). For normalization, RPS19 was selected as a reference transcript. Standard deviation was measured using duplicate.

