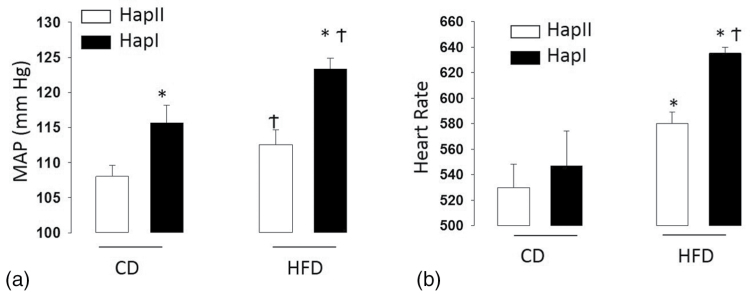
Figure 4.
Blood pressure (a) and heart rate (b) analysis in TG mice: each bar represents MAP or HR taken from 4 male animals over a period of 24 hours. The hourly mean was taken from the average of 6 MAP or HR data points at an interval of 10 minutes each. *P < 0.05 compared with Hap-II; †P < 0.05 compared with their control diet group. Results are shown as mean ± SE (n = 4). Abbreviations: HFD, high fat diet; HR, heart rate; MAP, mean arterial pressure; TG, transgenic.

