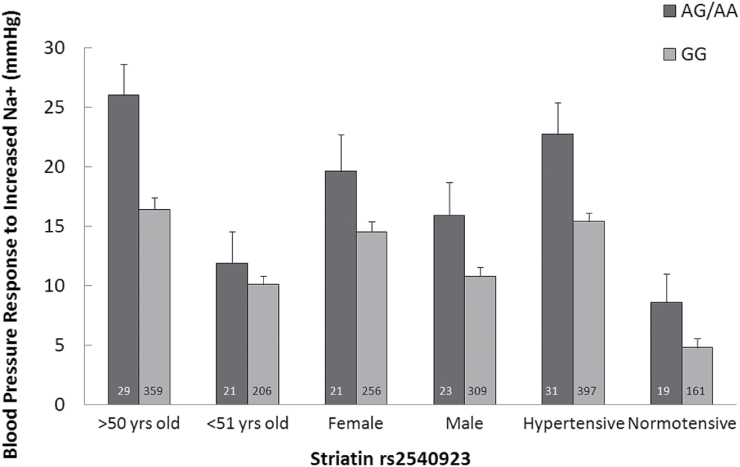
Figure 2.
Combined population, systolic SSBP stratified by age, gender, and hypertensive state. Risk allele carriers had greater systolic SSBP than noncarriers if they were normotensive (P = 0.03), hypertensive (P = 0.004), male (P = 0.02), female (P = 0.09), or older than 50 years of age (0.006). Because of multiple comparisons only those P values <0.017 reached statistical significance. The rest are considered trends. Data represents mean ± SEM.

