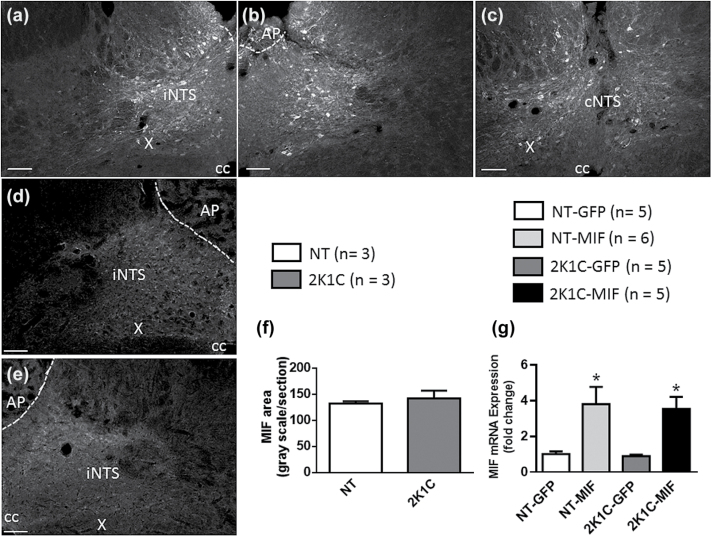
Figure 1.
Viral-mediated transduction of GFP and MIF into the NTS. Photomicrographs from coronal sections of rat brainstem (−14.0 to −14.7 mm from bregma). (a–c) Representative sequential images of the same animal showing MIF immunoreactivity in the NTS of a normotensive rat that received microinjections of AAV2-CBA-MIF 4 weeks before. (d and e) Endogenous MIF immunoreactivity from an intact normotensive (NT) and 2K1C hypertensive rats, respectively. Anti-MIF primary antibody was used at 1:300 and 1:500 dilutions for endogenous MIF expression and AAV2-CBA-MIF treated animals, respectively. Scale bar: 100 µm. (f) The area of endogenous MIF staining in the NTS of an intact NT and 2K1C hypertensive rats. (g) MIF mRNA levels in the NTS in NT or 2K1C hypertensive rats that received microinjections of AAV2-CBA-eGFP or AAV2-CBA-MIF. Data in f and g are means ± SEM; *P < 0.05 vs. corresponding GFP group; Student t test and 1-way ANOVA, followed by Student–Newman–Keuls, were used to analyze the data in f and g, respectively; n = number of animals. Abbreviations: ANOVA, analysis of variance; AP, area postrema; cc, central canal; cNTS, commissural nucleus of the solitary tract; iNTS, intermediate nucleus of the solitary tract; MIF, macrophage migration inhibitory factor; NTS, nucleus of the solitary tract; X, dorsal motor nucleus of vagus.

