
Fig. 2.
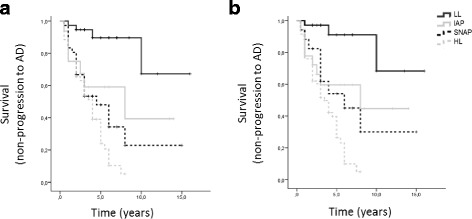
Kaplan–Meier survival curves for probability of conversion to AD according to different MCI biomarker-based subgroups. Number of individuals at risk at each time interval shown below the graphs. MCI subgroups determined taking into account CSF t-Tau and p-Tau levels and either Aβ42 (a) or the Aβ42/40 ratio (b). Log-rank (Mantel–Cox) p < 0.001 for both. AD Alzheimer’s disease, LL low-AD likelihood, HL high-AD likelihood, IAP isolated amyloid pathology, SNAP suspected non-Alzheimer pathology