
Figure 2.
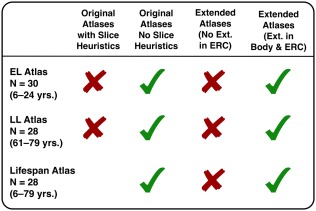
List of atlases generated and applied at different stages of validation work. Red Xs indicate atlases used at intermediate stages of the validation efforts, and green check marks indicate atlases used in reported analyses. The original atlases generated with the “slice heuristics” function in ASHS was only performed on the EL and LL samples, with no lifespan atlas generated. The optimization procedure included demarcation of subfields on one to two slices anterior and posterior, and was originally limited only to subfields and not ERC. Following inspection of the output from that atlas, additional demarcation was performed to similarly extend the labeling of ERC as well [Color figure can be viewed at http://wileyonlinelibrary.com]