
Figure 3.
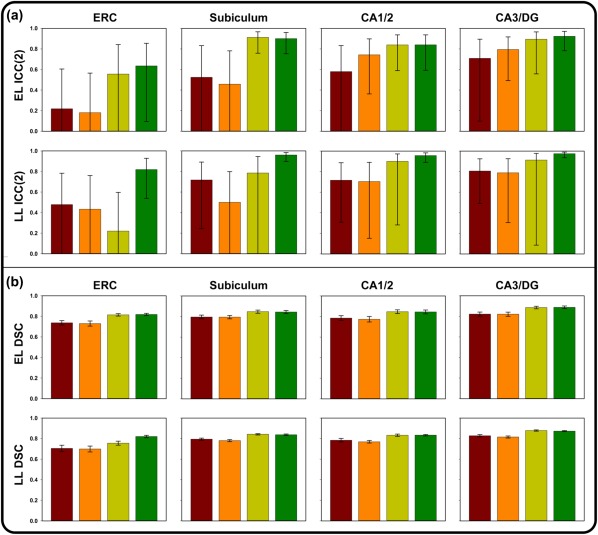
Results of validation attempts for four comparisons between manual and automated approaches in ASHS, including the sample‐specific atlas without optimization (red), the Lifespan atlas without optimization (orange), the sample‐specific atlas following optimization (yellow), and the Lifespan atlas following optimization (green). Error bars represent 95% confidence intervals. (a) ICC(2) values for the Early Lifespan sample (top) and the Late Lifespan sample (bottom). (b) DSC values for the Early Lifespan sample (top) and the Late Lifespan sample (bottom) [Color figure can be viewed at http://wileyonlinelibrary.com]