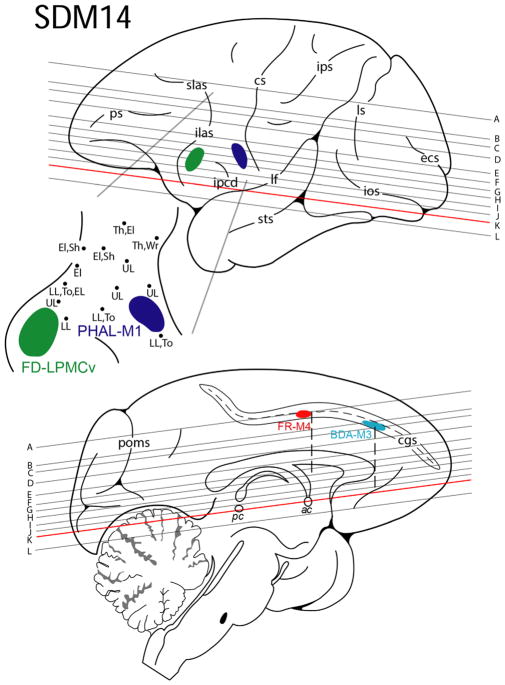
FIGURE 4.
Line drawing of the lateral (top) and medial (bottom) surfaces of the cerebral cortex illustrating the experimental design in case SDM14. Cortical injections (colored irregular spheres) were made into the orofacial representation of four different motor areas in the left hemisphere. The course of the corticobulbar pathway was mapped in the corona radiata, internal capsule and cerebral peduncle using immunohistochemical and fluorescent processed tissue sections. The top pullout depicts the location of the phaseolus vulgaris leucoagglutinin (PHAL) injection site in M1 (dark blue) and the fluorescein dextran (FD) injection site in LPMCv (green) in relation to physiological mapping on the lateral cortical surface. Each black dot represents a stimulation point labeled with the corresponding body part where the evoked movement was observed. Shown on the medial surface is the fluoro ruby (FR) injection site in M4 (red) and biotinylated dextran amine (BDA) injection site in M3 (light blue) in the opened cingulate sulcus (cgs). The horizontal lines indicate the level of each representative tissue section shown graphically in Figure 5 and are in reference to the anterior (ac) and posterior (pc) commissural plane (see horizontal section k). For abbreviations: see list

