
Figure 1.
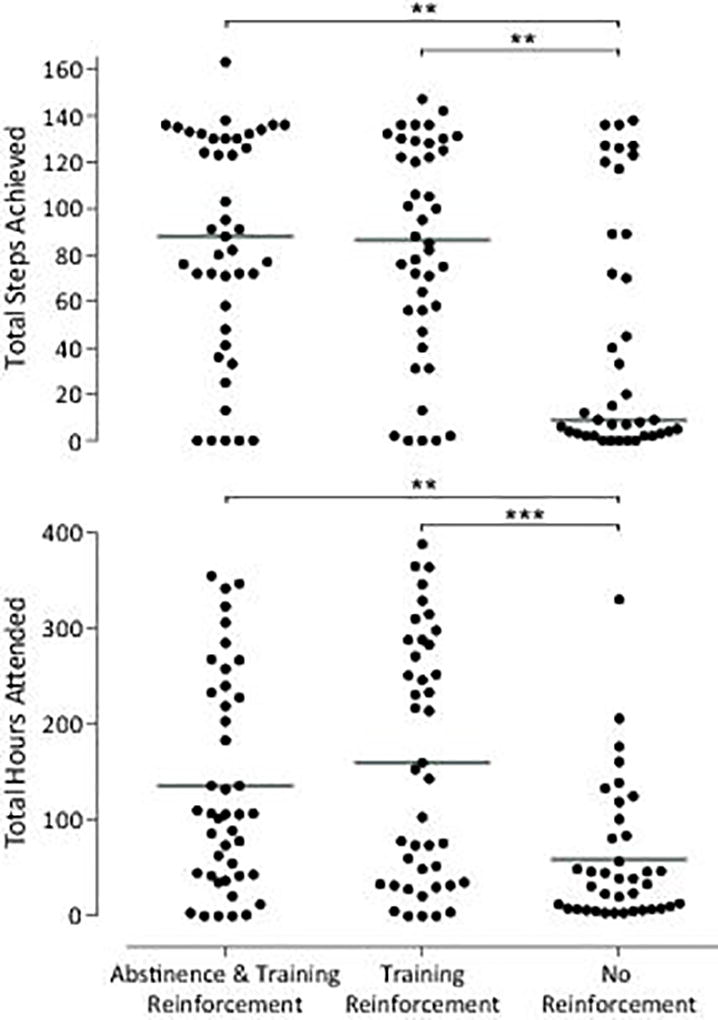
Total steps achieved (top panel) and total hours attended (bottom panel) for each of the three groups. Individual points represent individual participants, and horizontal bars indicate the median values for the group. Asterisks indicate significant differences between groups with Dunn’s post hoc tests (** p < .01, *** p < .001).