
Figure 2.
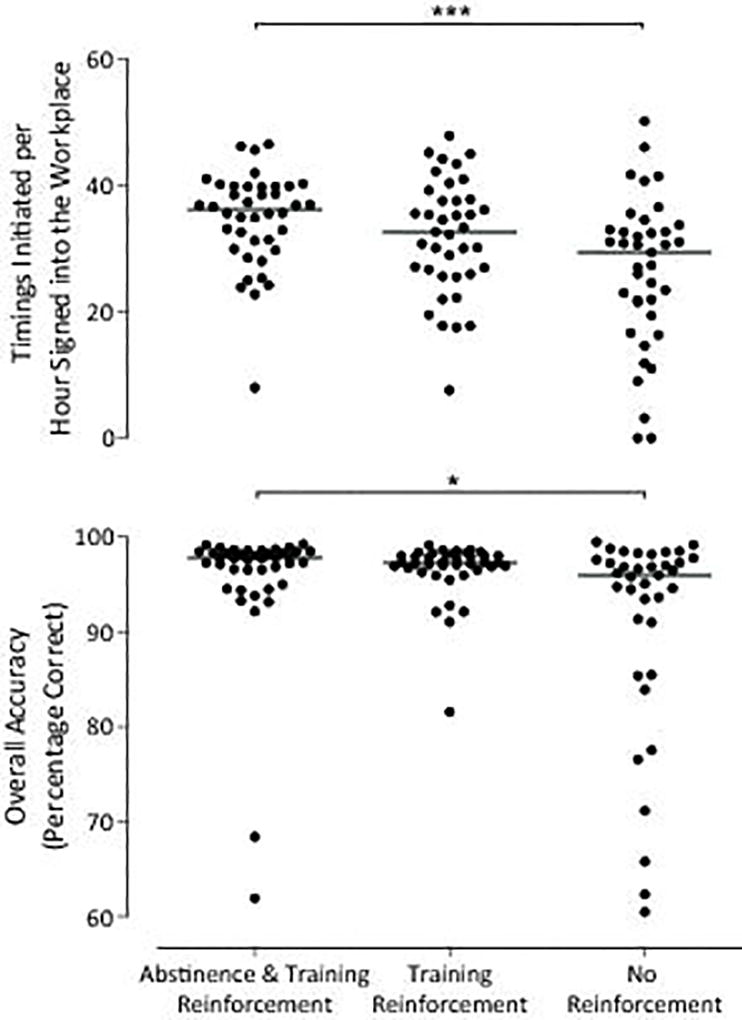
Timings initiated per hour signed into the workplace (top panel) and overall accuracy (bottom panel) for each of the three groups. Individual points represent individual participants, and horizontal bars indicate the mean values for the group. Asterisks indicate significant differences between groups with Dunn’s post hoc tests (* p < .05, *** p < .001).