Figure 3.
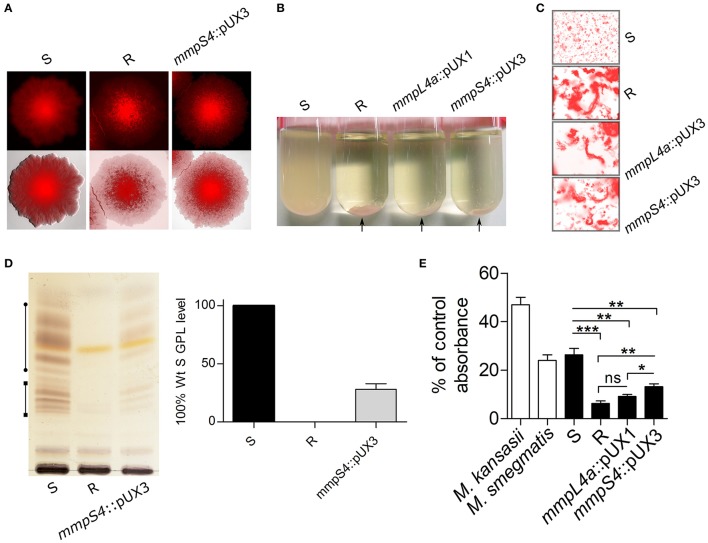
Single cross-over promoter replacement of mmpS4. (A) Representative bright field, fluorescence and composite images showing the rough colony morphology associated with the mmpS4::pUX3 strain. (B) Like the R, but unlike the S variant, mmpS4::pUX3 sediments rapidly in liquid culture. Exponentially growing cultures (OD600 = 1) were transferred to glass tubes and allowed to sediment for 10 min before pictures were taken. Arrows indicate the sedimented bacterial aggregates. (C) Representative fluorescence images showing serpentine cords in broth culture of M. abscessus R, mmpL4a::pUX1 and mmpS4::pUX3 but not of M. abscessus S. (D) Left: Low-level GPL production is maintained in mmpS4::pUX3 as assessed by TLC, despite its rough colonial phenotype and aggregative properties. The line with circle caps indicate diglycosylated GPL, while the line with the square caps indicate triglycosylated GPL. Right: TLCs produced as in the left from four independent experiments were subjected to a densitometric analysis in order to determine the relative level of GPL present in the mmpS4::pUX3 mutant. Shown is the mean and standard deviation calculated from these experiments. (E) M. abscessus R is more hydrophobic than S, while the mmpS4::pUX3 mutant strain's hydrophobicity is between S and R, as assessed by hexadecane partitioning and shown as hydrophobicity index (in percentage of aqueous phase OD prior to partitioning). Histograms and error bars are means and standard deviations of at least three independent experiments. Differences between means were analyzed for significance using a two-tailed Student's T-test employing Welch's correction for unequal variances. Ns, non-significant, *p < 0.05, **p < 0.01, ***p < 0.001.

