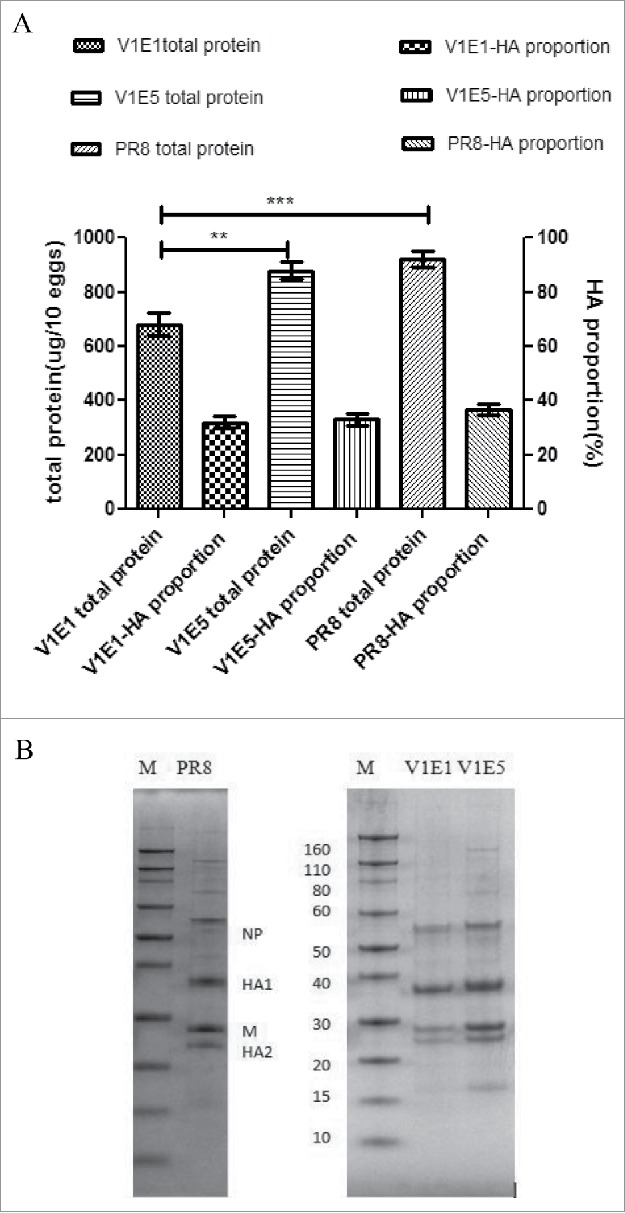
Figure 4.

A Total protein content (left Y axis) and HA proportion (right Y axis). Total protein content per 10 eggs of each virus. HA proportion was determined using the following equation: HA1+HA2 /HA1+HA2+NP+M. B SDS-PAGE profile of various influenza viruses using the same sample amount. M: Marker (KD). PR8: A/Puerto Rico/8/34 generated by RG; V1E1: RG-17SF003V1E1 with initial rescued in Vero cells followed by 1 passage growth in eggs; V1E5: RG-17SF003V1E5 with initial rescued in Vero cells followed by 5 passages growth in eggs. The data was the results of two independent tests and analyzed by two-way ANOVA using GraphPad Prism 5 software package (version 5.0).** represents p < 0.01; *** represents p < 0.001.
