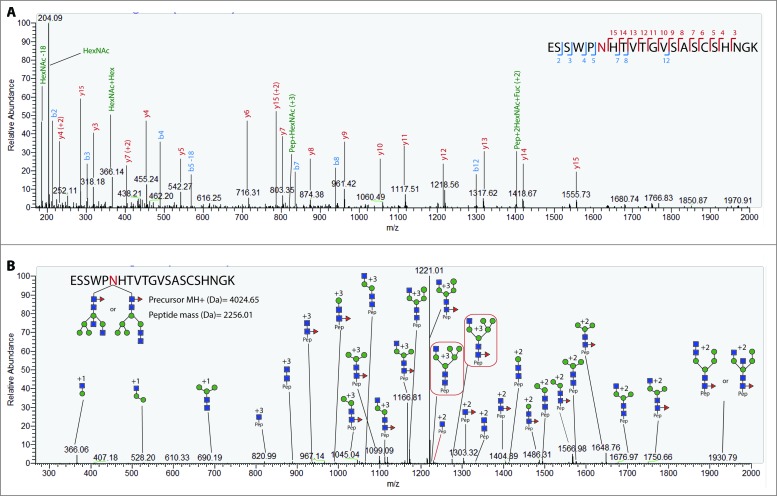
Figure 3.
Representative CID and HCD spectra of H1 glycopeptides. (A) Annotated HCD spectrum of glycopeptide ESSWPNHTVTGVSASCSHNGK. The spectrum exhibits the diagnostic oxonium ion at 204.08 m/z and the presence of b and y ions derived from backbone fragmentation. (B) Annotated CID spectrum of glycopeptide ESSWPNHTVTGVSASCSHNGK with an attached glycan with a HexNAc(4)Hex(5)Fuc(1) composition. Sequential glycan fragmentation is predominant in the spectrum and allows for the validation of predicted glycan composition. The presence of a core fucose can be confirmed by the detection of ion Pep+2HexNAc-Fuc in both the HCD and CID spectra.

