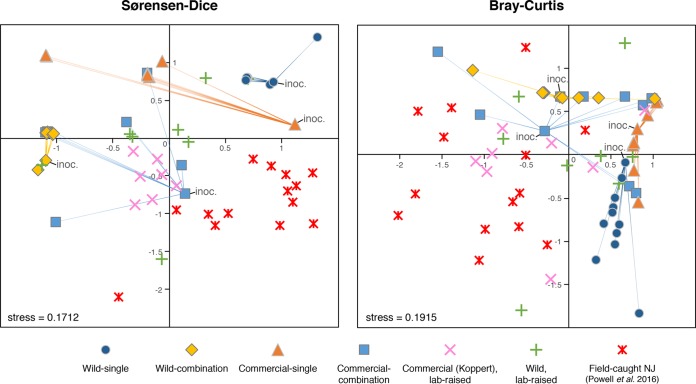
FIG 2.
Nonmetric multidimensional scaling (NMDS) plots of community dissimilarities based on Sørensen-Dice and Bray-Curtis distances. Input samples used for inoculation of experimental microbiota treatments are denoted by “inoc.” and by lines connecting to the resulting output microbiomes. Communities were compared at a depth of 5,000 reads per sample; samples with <600 reads and samples from the filtrate treatment were excluded.

