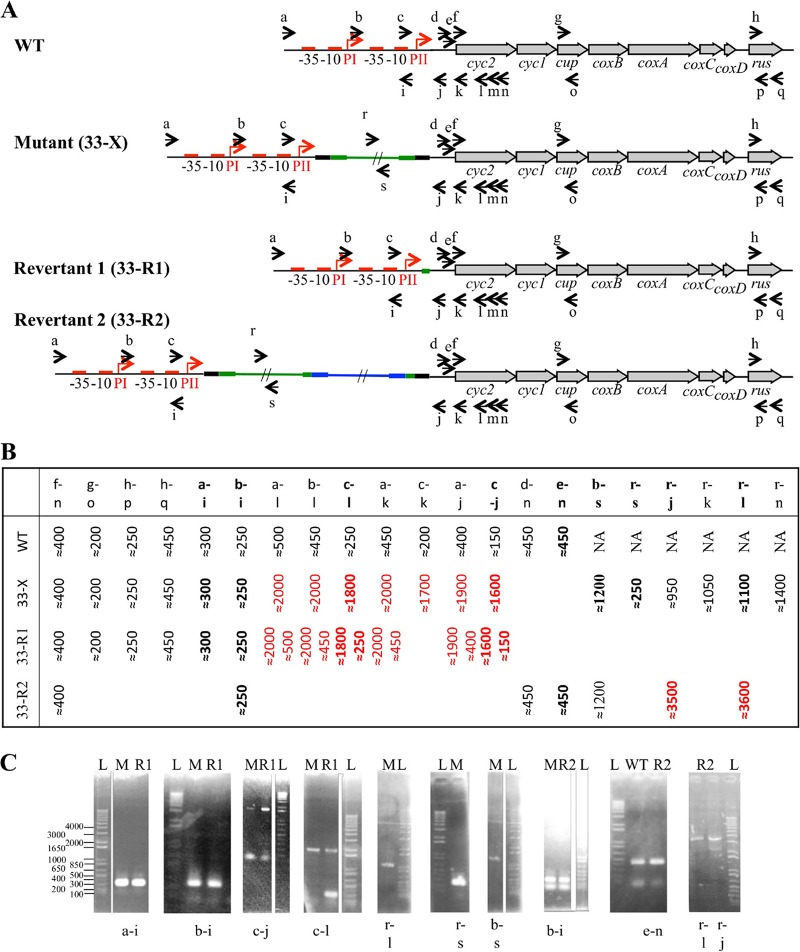
FIG 1.
PCR analysis of the rus operon of the salt-tolerant derivative (33-X) and the two revertants (33-R1 and 33-R2). (A) Schematic representation of the rus operon in the mutant and the revertants. The primers used (Table 1) are indicated as small arrows. The ISAfd1 and the IS66 are in green and blue, respectively. Their terminal inverted repeats are represented with a thicker green or blue line. The direct repeats generated on insertion are represented with a thicker black line. (B) Sizes (in base pairs) of the expected (WT) or observed amplicons in the salt-tolerant derivative (33-X) and the revertants (33-R1 and 33-R2). (C) Results of PCR performed on the salt-tolerant derivative (33-X) and the two revertants (33-R1 and 33-R2). L, 1 Kb Plus DNA Ladder (Thermo Fisher Scientific).

