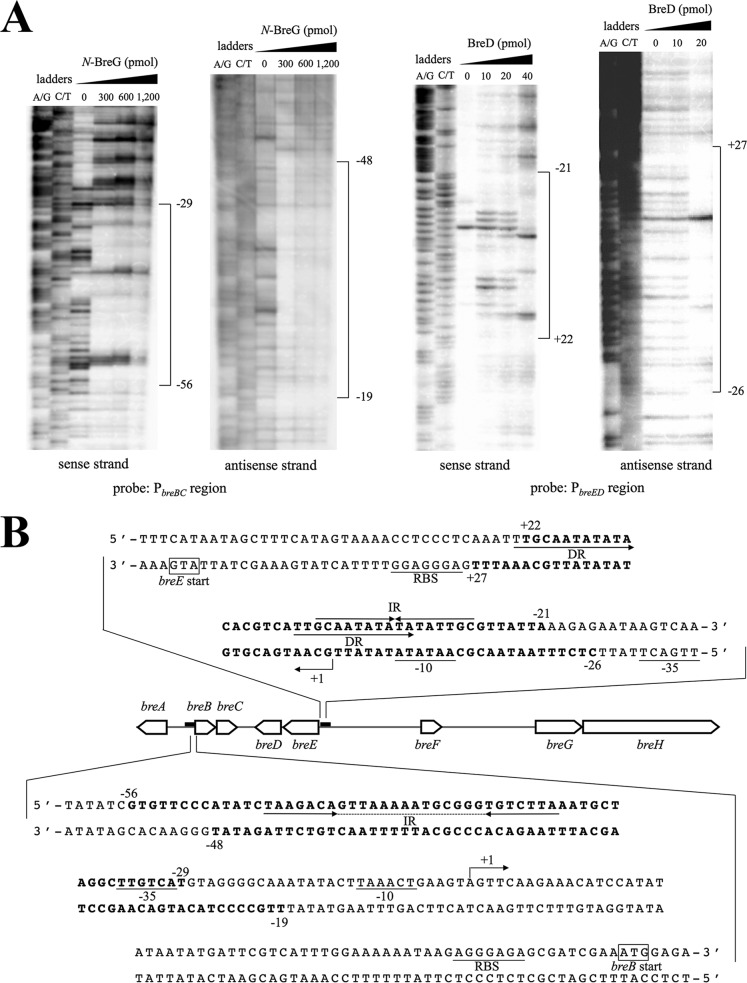
FIG 2.
Binding sites of BreD and BreG to the promoter region of breED and breBC, respectively. (A) DNase I footprinting for the determination of BreD and BreG binding sites upstream of breED and breBC, respectively. The amounts of BreD (10 to 40 pmol) and N-BreG (300 to 1,200 pmol) used for the assay are indicated at the top of each lane. A probe amplified with a 5′-end-biotinylated primer was used. The nucleotide corresponding to the first nucleotide of the transcribed RNA is numbered +1. (B) Nucleotide sequences of the predicted binding site of BreD or BreG. The numbers indicate positions from the transcription starting point, beginning with +1. The putative RBS, −10, and −35 regions are underlined. The regions protected by both regulators are in bold. The arrows indicate direct repeats (DR) and inverted repeats (IR). The dotted line indicates spacer sequences. The transcriptional start point is marked with a bent arrow.

