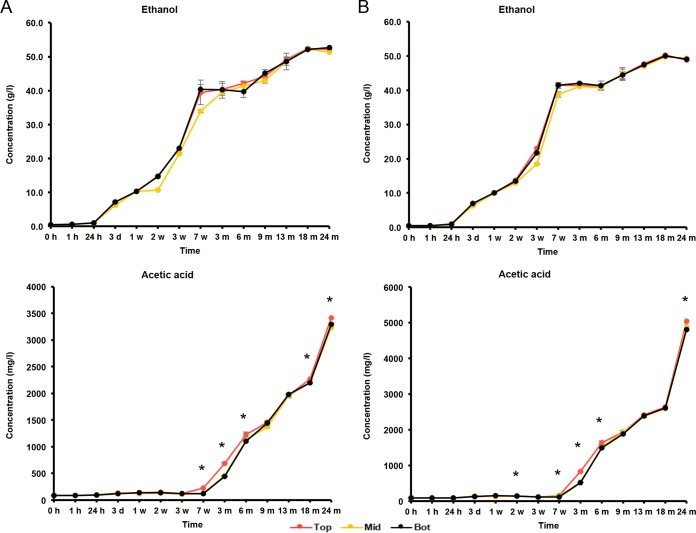
FIG 7.
Production of ethanol and acetic acid in cask 1 (A) and cask 2 (B) at the tops (Top), middles (Mid), and bottoms (Bot) of the casks during a 24-month lambic beer production process. Statistically significant differences (P < 0.05) between samples taken at the tops and those at the middles and bottoms of the casks are marked with asterisks.

