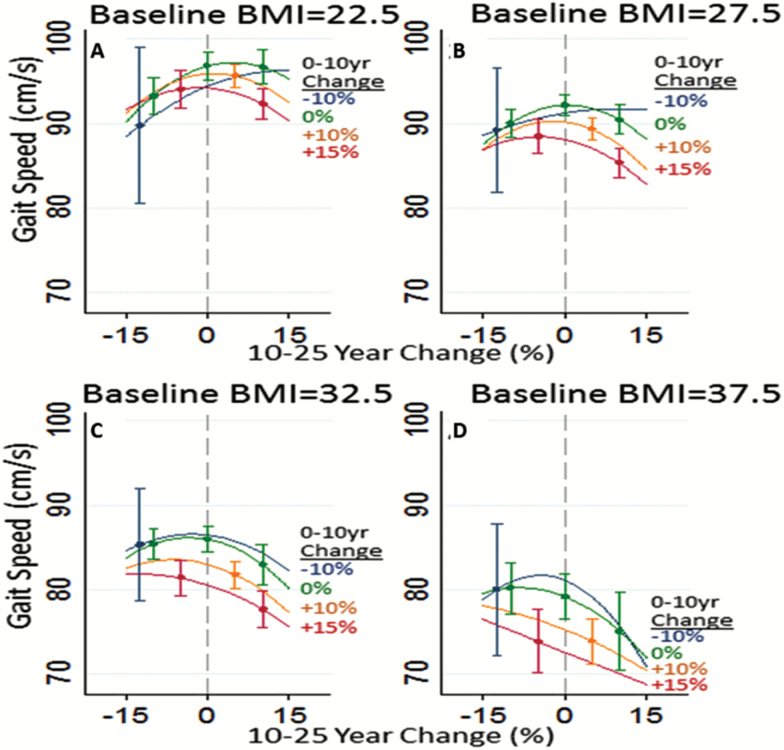
Figure 2.
Model estimates of Visit 5 gait speeds (y-axis) for participants with different baseline body mass index (BMI) values, by BMI changes in Years 0–10 and BMI changes in Years 10–25. Years 10–25 BMI changes (%) are shown on the x-axis. Colored lines represent BMI changes (%) in Years 0–10: 10% decrease (black line (blue line online)), 0% change (gray line (green line online)), 10% increase (light gray line (orange line online)), and 15% increase (red line). (A) Baseline BMI = 22.5 kg/m2, (B) Baseline BMI = 27.5 kg/m2, (C) Baseline BMI = 32.5 kg/m2, and (D) Baseline BMI = 37.5 kg/m2.

