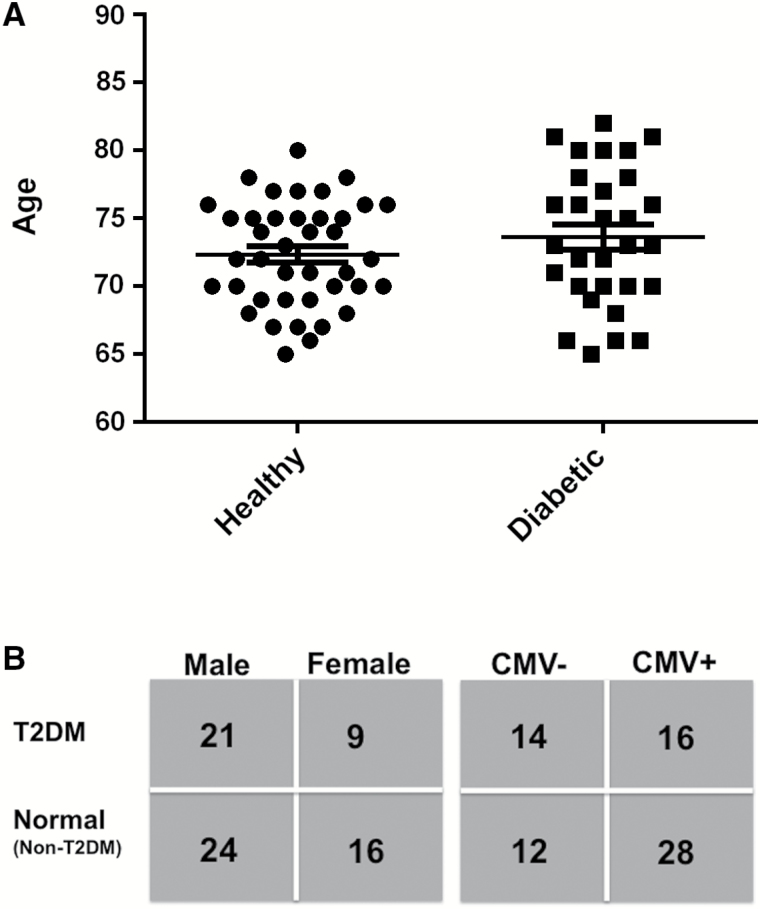
Figure 1.
Overview of the study population. (A) Age distribution of healthy and T2DM groups (mean ± SE). (B) Number of individuals within in each group by gender and CMV status. The numbers based on age and sex according to CMV status are as follows: male, CMV+ (n = 29); male, CMV− (n = 16); female, CMV+ (n = 15); and female, CMV− (n = 10). Originally 71 participants were enrolled; however, one male with T2DM dropped out.

