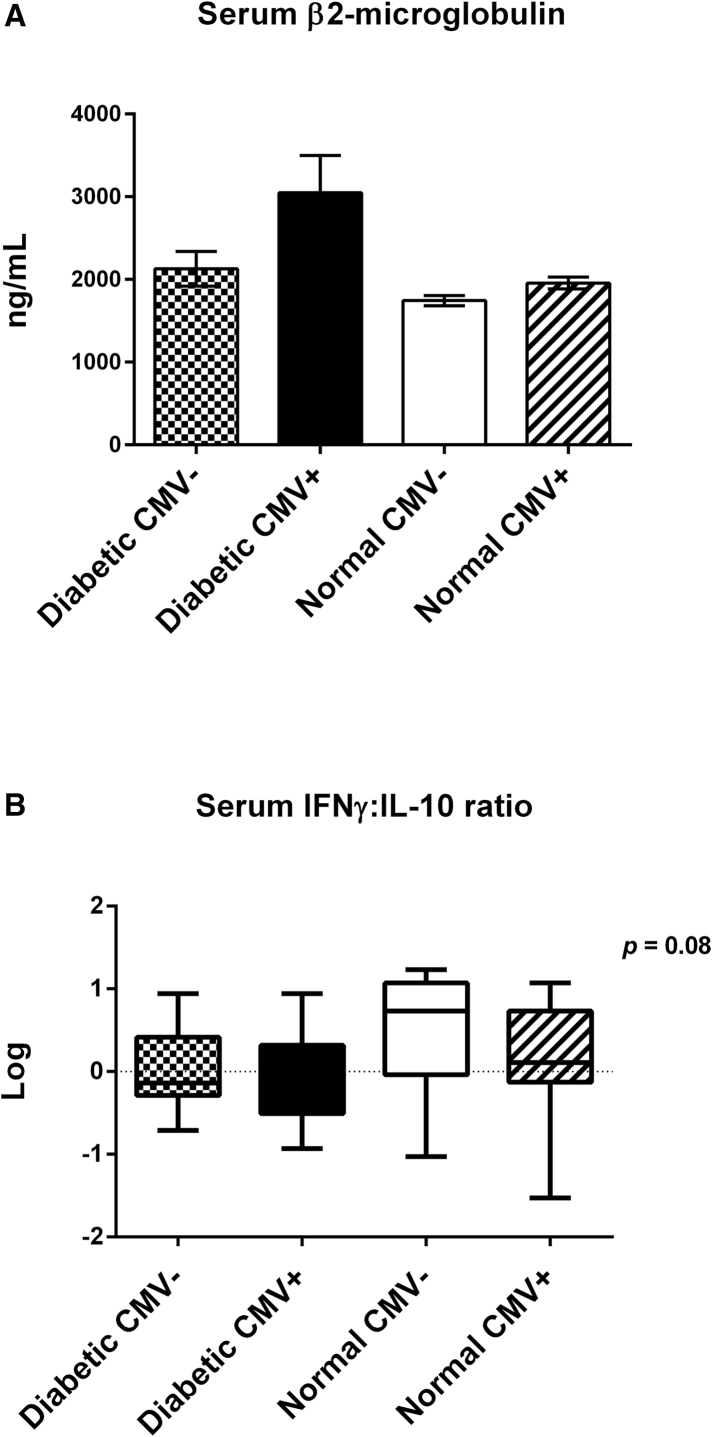
Figure 2.
The inflammatory profile of diabetic CMV+ older adults contrasts with that of healthy CMV− older adults. (A) Comparison of serum β2-microglobulin (a predictor of mortality) levels among the four groups shows a trend (Kruskal–Wallis, p > .05) toward increased levels in diabetic CMV+ older adults compared to the other three subsets. Error bars represent standard error of the mean. (B) Log transformed values for the IFN-γ:IL-10 ratio in serum show a trend toward higher ratios in healthy CMV− older adults compared to the other three subsets (Kruskal–Wallis, p = .08). Horizontal lines represent median values, boxes represent the 25th and 75th percentiles and vertical lines represent the 10th to 90th percentiles. The number of older adults in each subset is: diabetic CMV− (n = 14), diabetic CMV+ (n = 16), normal CMV− (n=12), and 28 normal CMV+ (n = 28).

