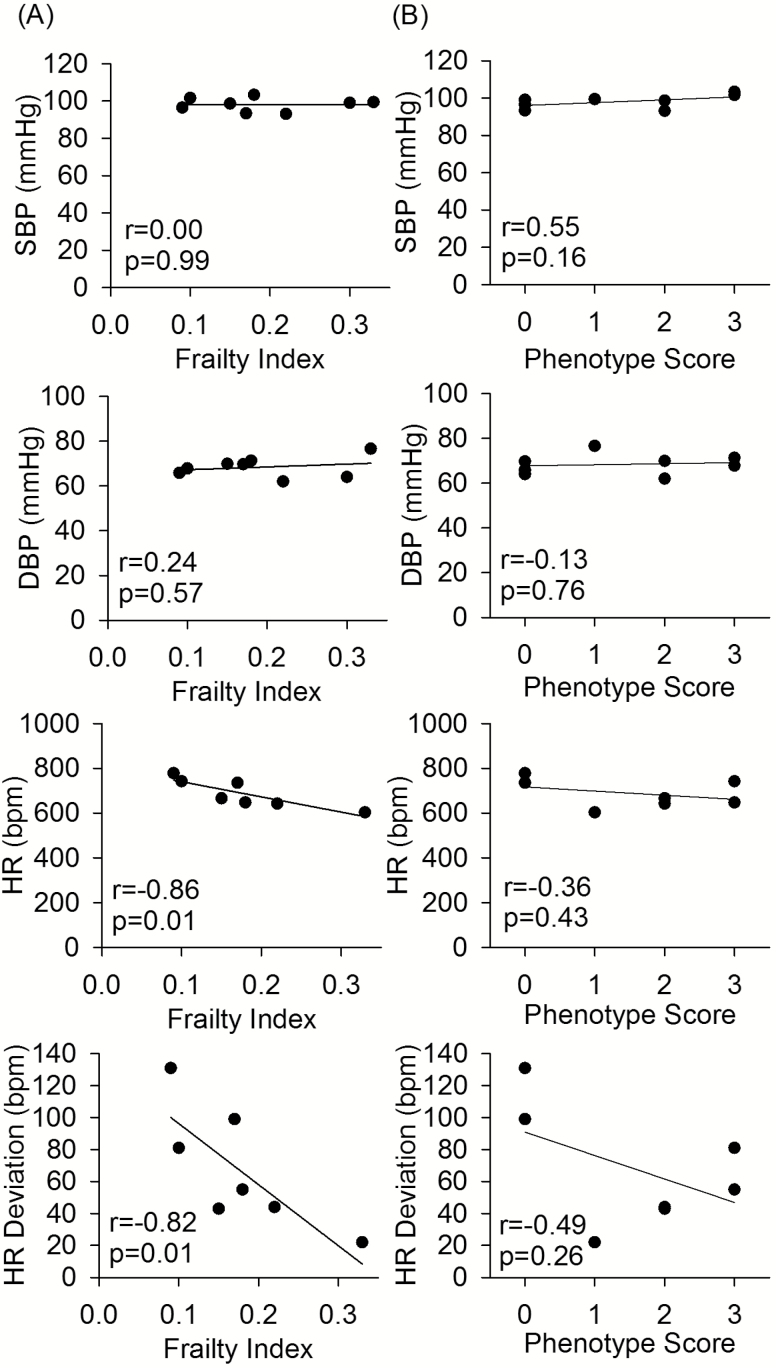
Figure 3.
The correlation of (A) mouse clinical frailty index scores and (B) modified frailty phenotype scores, with systolic blood pressure (SBP), diastolic blood pressure (DBP), heart rate (HR), and HR deviation, for old (99.6 ± 1.2 weeks) male C57BL/6 mice. Pearson correlation coefficient values (r) and p values are shown on each of the graphs. n = 8 for all BP graphs and n = 7 for HR graphs.

