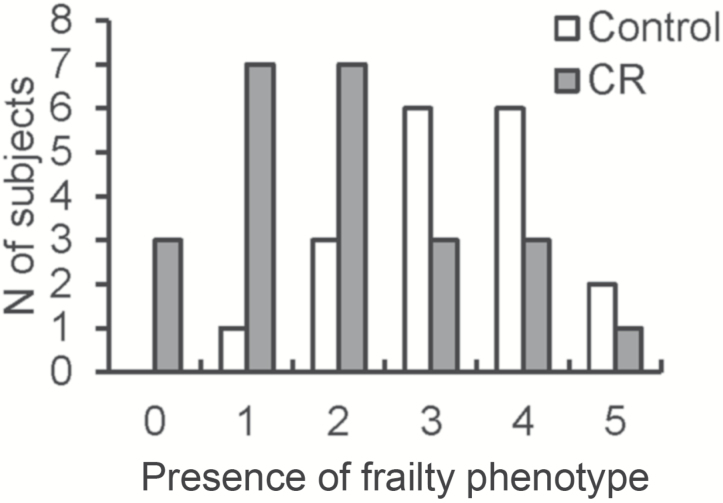
Figure 3.
The presence of Fried frailty phenotype in C and CR groups. Open bars represent C animals, closed bars represent CR animals. Bars indicate the number of subjects per group presenting with the number of phenotypes identified on the x-axis. Animals with no frailty phenotypes are defined as not frail, 1–2 phenotypes are prefrail, and 3–5 phenotypes are frail. The prevalence of nonfrail, prefrail, and frail between the C and CR groups were compared by chi-square test.

