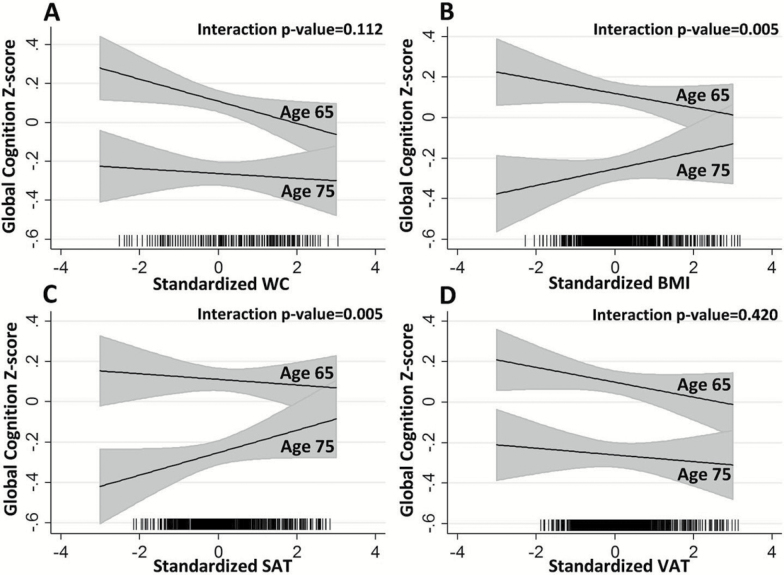
Figure 1.
Adjusted relationships of global cognitive z-scores at ages 65 and 75 years with standardized adiposity measures: (A) waist circumference (WC), (B) body mass index (BMI), (C) subcutaneous adipose tissue (SAT), and (D) visceral adipose tissue (VAT). Panels show results from separate models with single adiposity measures. p Values for age-by-adiposity interactions are shown. Rug plots (x-axis tick marks) denote the distributions of observed adiposity.

