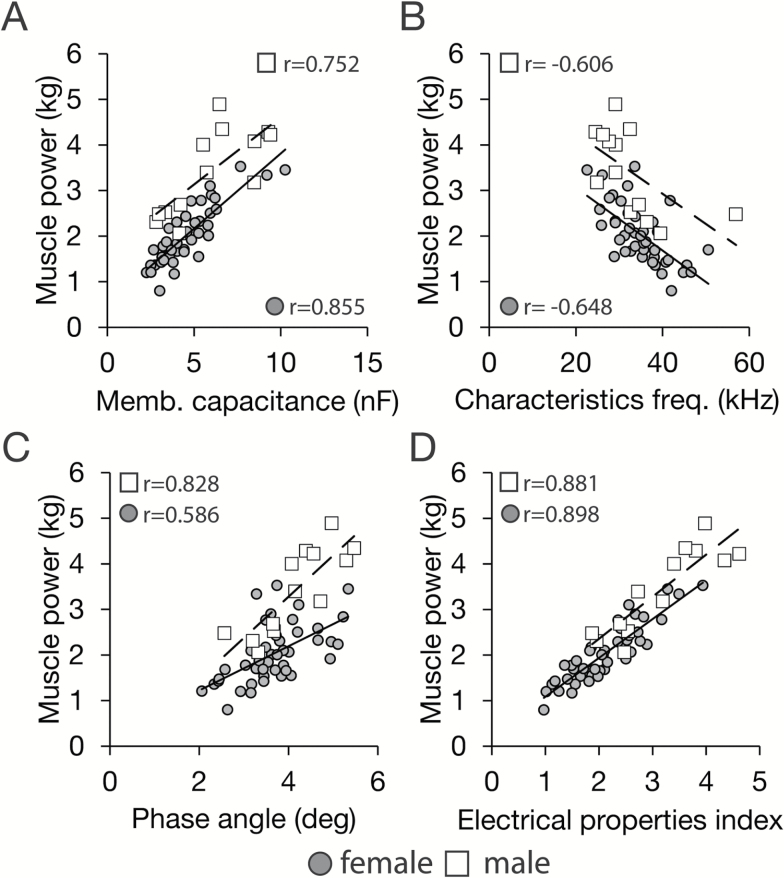
Figure 4.
Segmental bioelectrical impedance spectroscopy (S-BIS) parameters correlate with leg muscle power. Relationship between leg muscle power and (A) membrane capacitance (Cm), (B) characteristics frequency (fc), (C) phase angle (φ), and (D) S-BIS electrical properties index model. The S-BIS model was calculated by stepwise multiple regression analysis with following equation: (0.362 × IC index) + (2.498 × Resistance differential) + (−0.319 × Cm) + (−0.034 × fc) + 0.997 (Supplementary Table 1). This model explained 77.6% and 80.7% of variance of leg muscle power in men and women, respectively.

