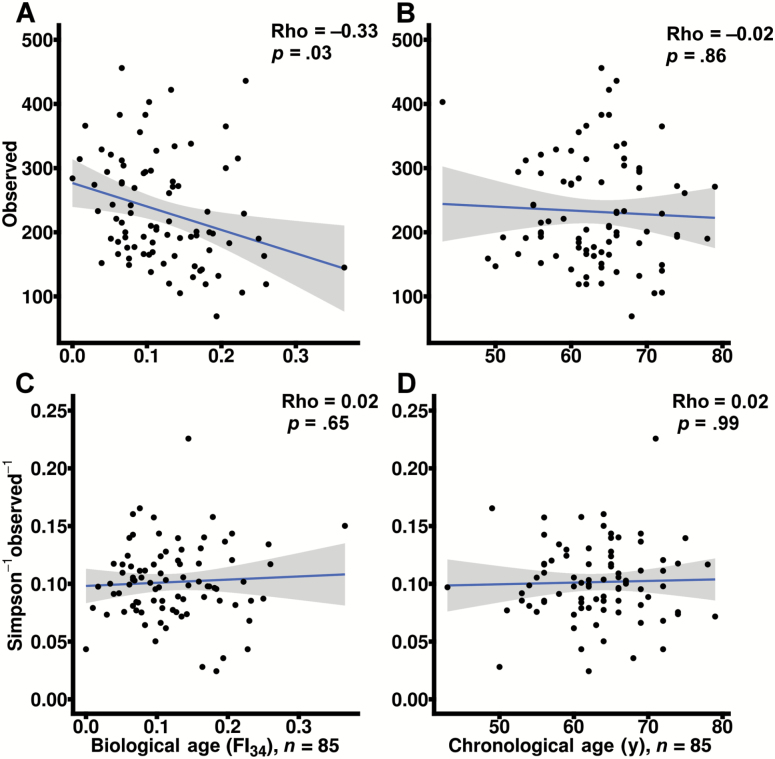
Figure 1.
FI34 score negatively correlates with stool sample richness. The total number of observed unique sequence variants (denoised sequenced read clusters) in each sample (observed richness) and the evenness of sequence variants in each sample based on the inverse Simpson evenness index were calculated and plotted against FI34 scores and chronological age (A−B and C−D, respectively). Biological age (A and C) and chronological age (B and D) p values are corrected for subject body mass index, sex, sample read depth, family membership, antibiotic usage, and chronological age or FI34. Data are derived from raw sequence variant counts. Spearman rho correlation statistics are additionally provided as indicated. Linear best-fit lines are plotted with shaded 95% confidence intervals.

