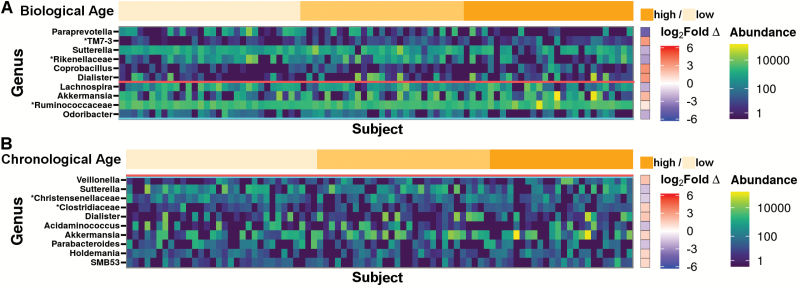
Figure 3.
Divergent taxa correlate with FI34 score and chronological age. DESeq2-normalized genus-level OTU abundances are expressed as a heatmap. Taxon abundances are sorted along the x-axis by (A) increasing FI34 score or (B) chronological age. Differential abundance of genus-level OTUs between lower (light orange), middle (middle orange), and upper (dark orange) 33rd percentiles of FI34 or chronological age was calculated using DESeq2. Log2 fold-change (Log2 fold ∆) in abundance is expressed as a ratio of the taxon abundance in high-level over low-level FI34 or chronological age. Shades of red fold-change indicate higher abundance in the high group, whereas shades of blue indicate lower abundance in the high group. Group sizes were chosen to normalize sample size between FI34 and chronological age groups (FI34: low n = 30, middle n = 27, high n = 28; Age: low n = 32, middle n = 29, high n = 24). OTUs were filtered for prevalence in at least 25% of subjects. Significant differences in OTU abundances were observed between the lower and upper levels of FI34 scores but not chronological age after correction for multiple comparisons by false-discovery rate (FDR; q < 0.1 above horizontal red bar, p < .05 above the horizontal blue bar). Taxa are sorted down the y-axis by increasing p values. Low FI34 scores ranged from 0 to 0.083, middle scores ranged from 0.091 to 0.137, and high scores ranged from 0.142 to 0.365. Supplementary Figures 3 and 4 contain expanded heatmaps for the results of all tested genera sorted by increasing FI34 score or chronological age, respectively. “*” indicates substitution of higher clade name in lieu of unassigned genus.

