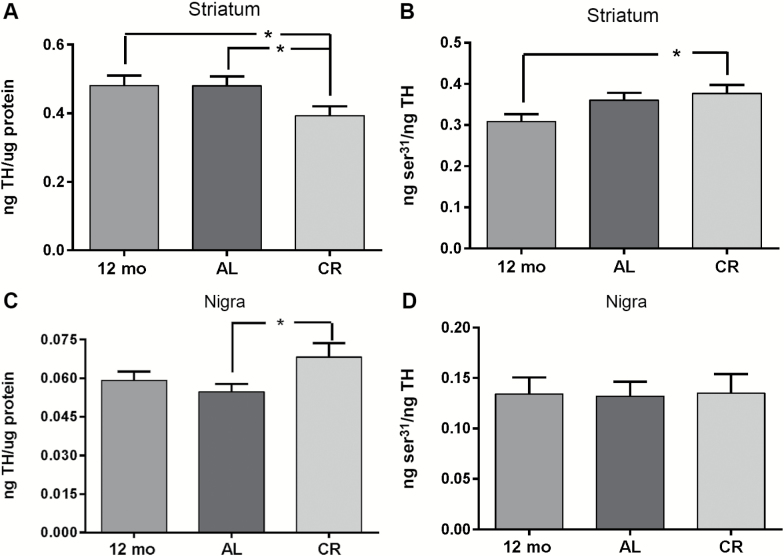
Figure 5.
Tyrosine hydroxylase (TH) protein expression and ser31 TH phosphorylation. (A) Striatum, total TH. There was a significant difference in TH protein across all groups (one-way ANOVA, F(2,37) = 3.83, p < .05). TH protein expression was significantly less in the calorie restriction (CR) group compared with the AL and 12-month control group. Post hoc (12-month control vs AL, t = 0.04, ns; *12-month control vs CR, t = 2.25, p < .05; *AL vs CR, t = 2.45, p < .05). (B) Striatum, ser31 TH phosphorylation. ser31 phosphorylation TH protein was significantly increased in the CR group versus 12-month-old control group. One-way analysis of variance (ANOVA; F(2,37) = 3.16, p = .054), (post hoc 12-month control vs CR, t = 2.48, p < .05; AL vs 12-month control, t = 1.64, ns; AL vs CR, t = 0.88, ns). (C) Substantia nigra, total TH. TH protein expression was significantly greater in the CR group compared with the AL group. One-way ANOVA (F(2,37) = 2.73, p = .08), (post hoc 12-month control vs AL, t = 0.70, p = .49; 12-month control vs CR, t = 1.44, p = .17; *AL vs CR, t = 2.29, p < .05). (D) Substantia nigra, ser31 TH phosphorylation. No significant differences in ser31 TH phosphorylation were observed among the three groups. One-way ANOVA (F(2,37) = 0.01, p = .99), (post hoc 12-month control vs AL, t = 0.08, ns; 12-month control vs CR, t = 0.03, ns; AL vs CR, t = 0.12, ns).

