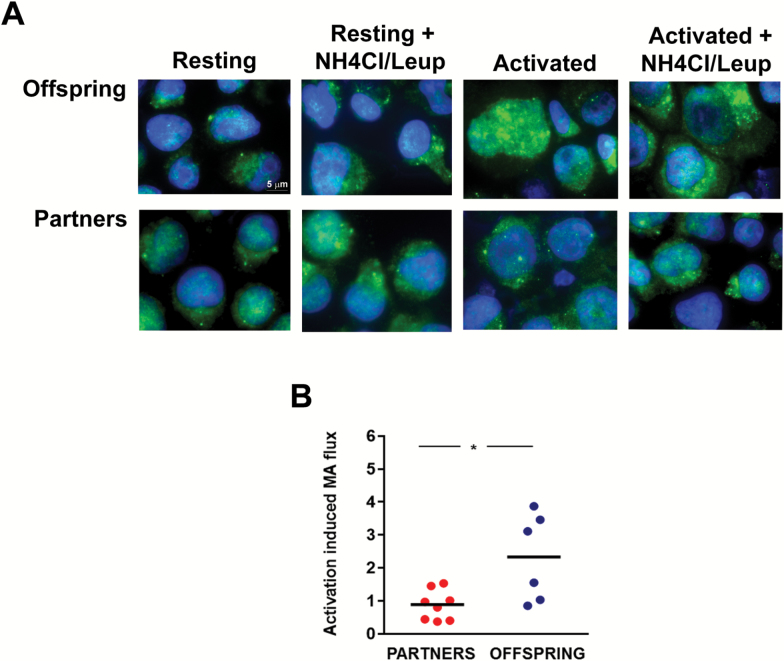
Figure 2.
Autophagy flux induced by TCR and CD28 engagement in CD4+ T-cells from the Leiden Longevity Study. (A) Representative immunofluorescence fields showing LC3 staining (green) in CD4+ T-cells obtained from the offspring of extended longevity parents or their control partners that were either left resting or stimulated and anti-CD3+anti-CD28-coated beads for 24 hours. During the last 3 hours, NH4Cl and leupeptine were added to the cell cultures to inhibit lysosomal proteases and assess LC3+ vesicle turnover (autophagy flux). Nuclei are stained with DAPI in blue. (B) Quantification of autophagy flux induced by stimulation with antiCD3 and antiCD28 antibodies in CD4+ T-cells. Individual data points and median of the fold increase in autophagy flux caused by T-cell activation are shown. Data were analyzed with two-tail distribution t test (see Table 1 for the size of the populations; *p < .05).

