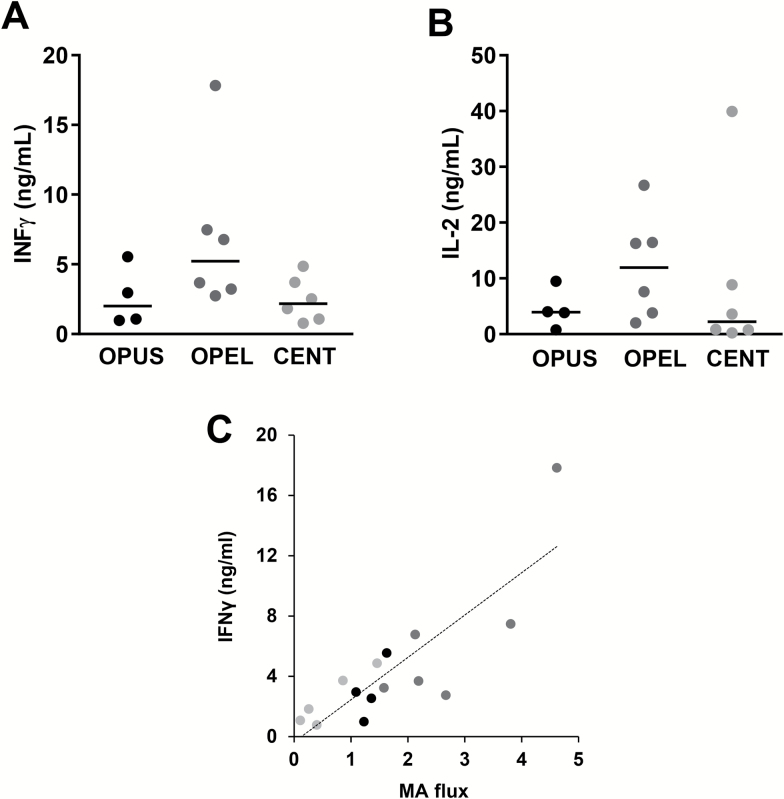
Figure 3.
Changes in autophagy flux with age correlate with levels of activation-induced interferon-γ (IFNγ) expression in CD4+ T-cells. IFNγ (A) and IL-2 (B) expression in activated CD4+ T-cells isolated from centenarians (CENT), the offspring of parents with exceptional longevity (OPEL), and the offspring of parents with usual survival (OPUS). Individual data points and median of the fold increase in autophagy flux caused by T-cell activation are shown. (C) Correlation plot between autophagy flux and IFNγ production (Pearson r = .835; p < .0001).

