. 2017 Oct 2;8(12):8150–8163. doi: 10.1039/c7sc02199b

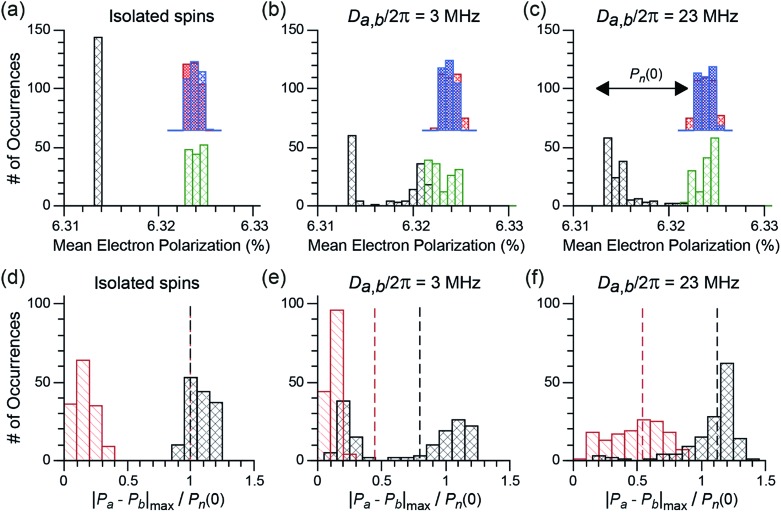
Fig. 6. (a–c) Histograms of the mean individual electron polarizations, Pa and Pb, at steady-state for 144 different crystallite orientations of a bis-nitroxide (red and blue) and a nitroxide-trityl (nitroxide in green, trityl in black) electron spin system with different dipolar couplings: (a) Da,b/2π = 0 (isolated electron spins), (b) Da,b/2π = 3 MHz, (c) Da,b/2π = 23 MHz. (d–f) Histograms of the maximum electron polarization difference |PaPb|max over one rotor period at the quasi-periodic steady state for 144 different crystallite orientations of a bis-nitroxide (in red) and a nitroxide-trityl (in black) electron spin-system with the same set of dipolar couplings as (a) to (c). |PaPb|max is normalized by the initial nuclear Boltzmann polarization Pn(0). The vertical dotted line (same color code as for the bars) represents the mean powder-averaged nuclear polarization at steady state scaled by Pn(0), and corresponds to the theoretical mean χdepo. In all calculations ωr/2π = 8 kHz, B0 = 9.399 T, T = 100 K, and 1H is the nucleus with polarization Pn that is hyperfine coupled (1.5 MHz) to electron a (the nitroxide electron, which also has a hyperfine interaction to a 14N spin ranging from 15 to 98 MHz).

Fig. 6